BTC ETH Daily Recap — July 18, 2026

BTC ETH Daily Recap — July 18, 2026
Today at a Glance
The crypto market on July 18, 2026, presented a subdued yet cautiously optimistic picture, with Bitcoin (BTC) and Ethereum (ETH) showing divergent short-term momentum. BTC traded at $64,110, posting a modest 24-hour gain of +0.28%, while ETH edged slightly lower by -0.03% to $1,841. Over the past week, BTC managed a +0.46% increase, while ETH outperformed with a +2.99% weekly gain, reflecting stronger relative demand for the second-largest asset. The 30-day trends reinforce this divergence: BTC rose +0.89%, whereas ETH surged +7.60%, recovering from a 30-day low of $1,512. Trading volumes for both assets were significantly below their 7-day averages—BTC at 0.25x and ETH at 0.17x—indicating reduced market participation and a potential consolidation phase. RSI readings for BTC (54.6) and ETH (57.5) remain in neutral territory, suggesting neither overbought nor oversold conditions. Overall, the market appears to be in a waiting pattern, with ETH showing stronger relative strength but both assets lacking decisive directional conviction.
Bitcoin Analysis
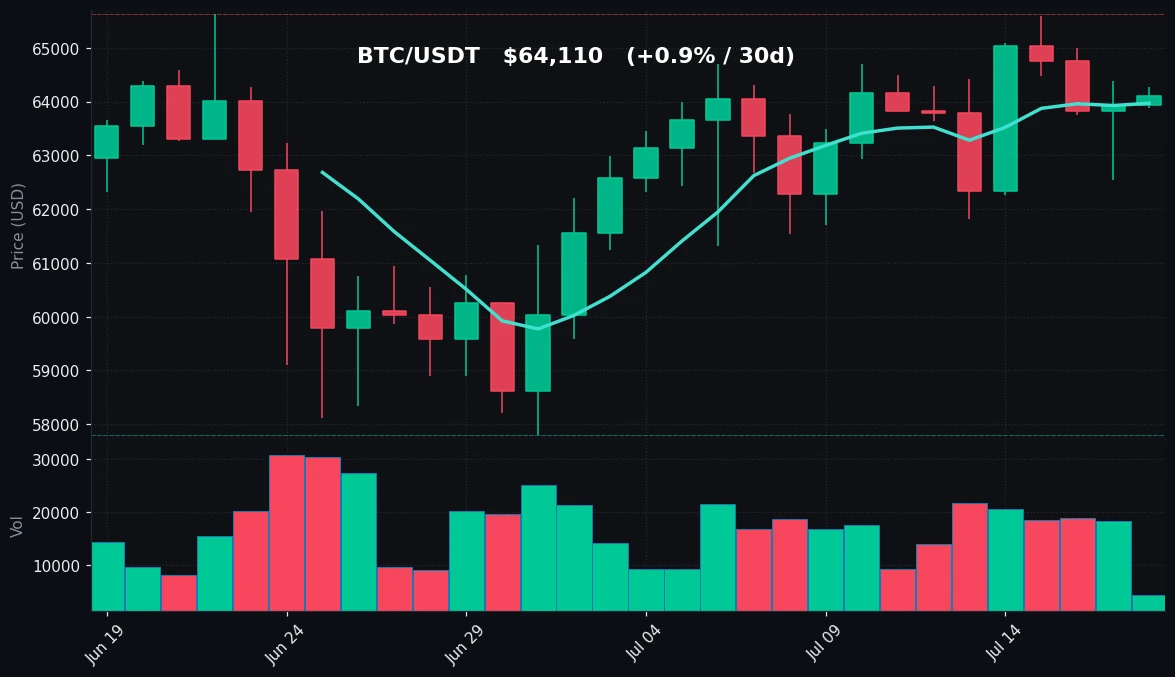
TradingView Live (4h)
Bitcoin’s price action on July 18 reflects a market in a state of low-volatility consolidation, with the asset trading at $64,110. The 24-hour range was narrow, spanning from a high of $64,274 to a low of $63,887, representing a mere 0.6% intraday fluctuation. This tight range suggests a lack of aggressive buying or selling pressure, as traders await clearer catalysts. Over the past seven days, BTC has oscillated between a high of $65,600 and a low of $61,825, indicating a broader range of approximately 6.1% that remains unresolved. The 30-day range extends from $57,800 to $65,623, with the current price sitting near the upper end of that band, hinting at potential resistance around the $65,600–$65,623 zone.
From a technical perspective, the 7-day moving average (MA7) sits at $63,970, marginally below the current price, while the 30-day moving average (MA30) is at $62,567, providing a solid support foundation. The price is trading above both short-term and medium-term moving averages, a configuration that typically signals a bullish bias, albeit a weak one given the proximity to MA7. The RSI(14) at 54.6 is neutral, suggesting neither momentum exhaustion nor accumulation pressure. This level is consistent with a market lacking a clear trend, as RSI values between 50 and 60 often accompany consolidation phases.
Volume analysis reveals a critical concern: the current trading volume is only 0.25 times the 7-day average. This dramatic drop in participation indicates that institutional and retail interest has waned, possibly due to the weekend effect or a broader market indecision. Low volume during price stability can be a precursor to either a breakout or a breakdown, as thin liquidity amplifies price moves. Without a volume catalyst, BTC is likely to remain range-bound between $63,970 (MA7) and $65,600 (7-day high). Key support levels to monitor include $63,887 (24-hour low) and $61,825 (7-day low), while resistance stands at $64,274 (24-hour high) and $65,600 (7-day high). The neutral RSI and low volume suggest that any directional move will require a significant external trigger, such as macroeconomic data or regulatory news.
Ethereum Analysis
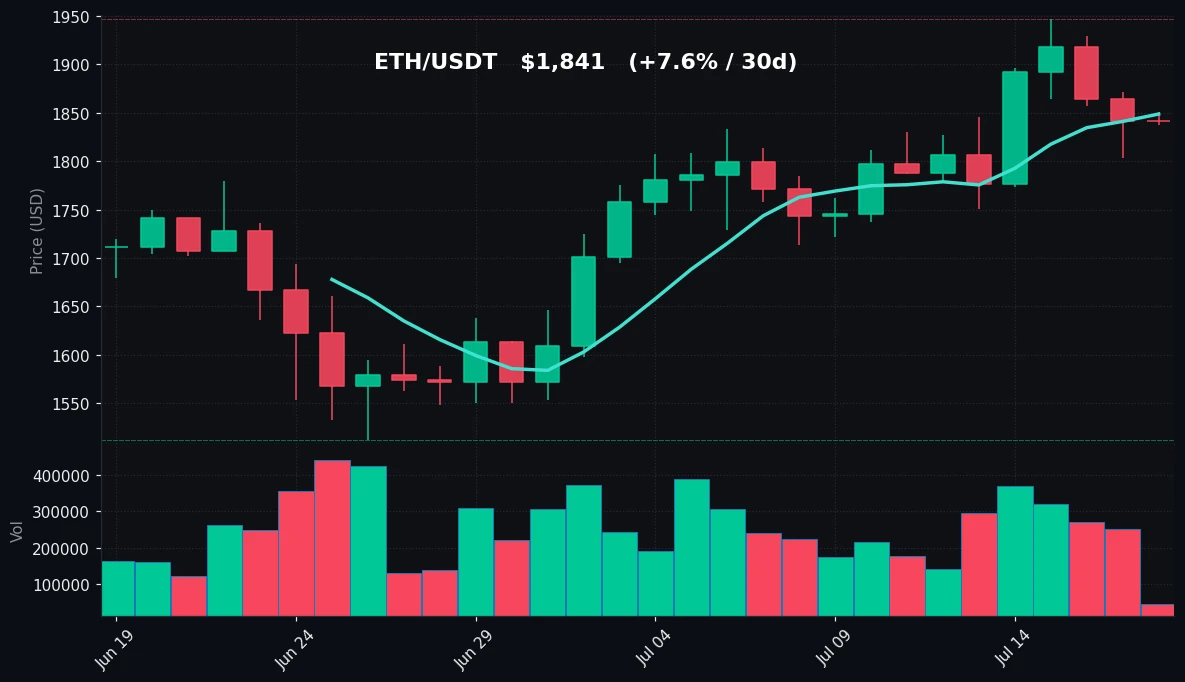
TradingView Live (4h)
Ethereum’s performance on July 18 shows a slight intraday decline of -0.03%, settling at $1,841, but the broader picture reveals stronger relative momentum compared to Bitcoin. The 24-hour range of $1,838 to $1,851 was exceptionally narrow, with only a 0.7% spread, indicating a market in consolidation. However, over the past week, ETH has gained +2.99%, and over 30 days, it has surged +7.60%, recovering from a 30-day low of $1,512 to its current level. This recovery has been driven by a notable 7-day high of $1,947, suggesting that ETH tested higher levels before pulling back.
Technically, ETH is trading just below its MA7 of $1,849, indicating short-term bearish pressure within the session. However, the MA30 at $1,729 is well below the current price, providing a strong medium-term support base. The price is still 6.5% above the MA30, which suggests that the medium-term trend remains intact despite the recent pullback from $1,947. The RSI(14) at 57.5 is neutral to slightly bullish, higher than BTC’s reading, which aligns with ETH’s better weekly and monthly performance. This RSI level is typical of a market that has seen a recovery but is not yet overextended.
Volume analysis for ETH shows an even more pronounced decline than BTC, with current volume at only 0.17 times the 7-day average. This extreme low volume suggests that the recent price action is being driven by thin liquidity, making the market susceptible to sharp moves. The gap between the 7-day high of $1,947 and the current price of $1,841 represents a 5.8% decline from the peak, indicating that sellers have stepped in near resistance. Key support levels include $1,838 (24-hour low), $1,750 (7-day low), and $1,729 (MA30). Resistance is seen at $1,851 (24-hour high), $1,947 (7-day high), and $1,947 (30-day high). The neutral RSI and low volume suggest that ETH may continue to consolidate between $1,750 and $1,947, with a potential bias toward the upside given its stronger 30-day momentum.
Key Technical Levels
| Asset | Support | Resistance | RSI |
|---|---|---|---|
| BTC | $63,887 (24h low), $61,825 (7d low), $57,800 (30d low) | $64,274 (24h high), $65,600 (7d high), $65,623 (30d high) | 54.6 — neutral |
| ETH | $1,838 (24h low), $1,750 (7d low), $1,729 (MA30) | $1,851 (24h high), $1,947 (7d/30d high) | 57.5 — neutral |
BTC vs ETH Dynamic
The relationship between Bitcoin and Ethereum on July 18 reveals a market where ETH is exhibiting relative strength, albeit with both assets in a low-volume consolidation phase. Over the past week, ETH has outperformed BTC by approximately 2.53 percentage points (+2.99% vs. +0.46%), and over 30 days, the gap widens to 6.71 percentage points (+7.60% vs. +0.89%). This divergence suggests that capital may be rotating from BTC into ETH, a pattern often seen when traders seek higher beta exposure during periods of market stabilization. The correlation between the two assets remains high, as evidenced by their similar narrow intraday ranges and low volume profiles, but the divergence in momentum indicates that ETH is leading the recovery. BTC’s market dominance may be under slight pressure, as ETH’s stronger technical structure (higher RSI, price above MA30 with more room) positions it as the preferred asset for risk-on positioning. However, the low volume environment means that this relative strength could be fragile and subject to reversal if broader market sentiment shifts.
Strategy Fit
Given the current market conditions of low volatility, neutral RSI readings, and significantly below-average trading volumes for both BTC and ETH, the most suitable trading strategy is a range-bound approach such as grid trading or DCA (Dollar-Cost Averaging). The narrow intraday ranges and lack of directional conviction make trend-following strategies risky, as false breakouts are more likely in low-volume environments. Grid trading, which capitalizes on price oscillations within a defined range, is particularly well-suited for this market. For BTC, a grid between $63,500 and $65,500 would capture the current consolidation zone, while for ETH, a grid between $1,800 and $1,950 aligns with the recent trading range. Pionex’s built-in grid trading bots can automate this process, allowing traders to profit from small price movements without constant monitoring. Alternatively, a DCA strategy focused on accumulating ETH during dips toward $1,750 (7-day low) or BTC near $62,000 could be effective for longer-term holders, given the neutral RSI and potential for a breakout. Trend-following strategies should be avoided until volume returns to at least 0.5x the 7-day average, as the current liquidity conditions increase the risk of slippage and false signals. The low volatility also makes arbitrage strategies less attractive, as spreads are minimal. Overall, a patient, range-bound approach with automated bots is the most prudent fit for today’s market environment.
Risk Disclaimer
This market recap is for informational and educational purposes only and does not constitute financial advice, investment recommendations, or solicitation to buy or sell any digital assets. Cryptocurrency markets are highly volatile and involve substantial risk of loss. Past performance is not indicative of future results. The technical analysis and strategies discussed are based on historical data and current market conditions, which may change rapidly. Readers should conduct their own independent research and consult with a qualified financial advisor before making any investment decisions. The author and platform assume no liability for any losses incurred as a result of using this information.
FAQ
What is the current price of Bitcoin and Ethereum on July 18, 2026?
Bitcoin (BTC) is trading at $64,110, up +0.28% in the last 24 hours. Ethereum (ETH) is at $1,841, down -0.03% over the same period.
Are BTC and ETH in overbought or oversold territory?
No. The RSI(14) for BTC is 54.6 and for ETH is 57.5, both in neutral territory. This indicates that neither asset is overbought (typically above 70) nor oversold (typically below 30).
Why is trading volume so low for both assets?
Current trading volume for BTC is only 0.25 times its 7-day average, and for ETH it is 0.17 times. This low volume is likely due to a combination of weekend reduced participation, market indecision, and a lack of major catalysts. Low volume can lead to increased volatility if a catalyst emerges.
What are the key support and resistance levels for BTC and ETH?
For BTC, support is at $63,887 (24h low), $61,825 (7d low), and $57,800 (30d low). Resistance is at $64,274 (24h high), $65,600 (7d high), and $65,623 (30d high). For ETH, support is at $1,838 (24h low), $1,750 (7d low), and $1,729 (MA30). Resistance is at $1,851 (24h high) and $1,947 (7d/30d high).
Which asset has performed better over the past month?
Ethereum has outperformed Bitcoin over the past 30 days, gaining +7.60% compared to BTC’s +0.89%. This relative strength suggests that ETH is leading the current recovery phase, though both assets remain in a low-volume consolidation pattern.


