BTC ETH Daily Recap – July 7, 2026

BTC ETH Daily Recap – July 7, 2026
Today at a Glance
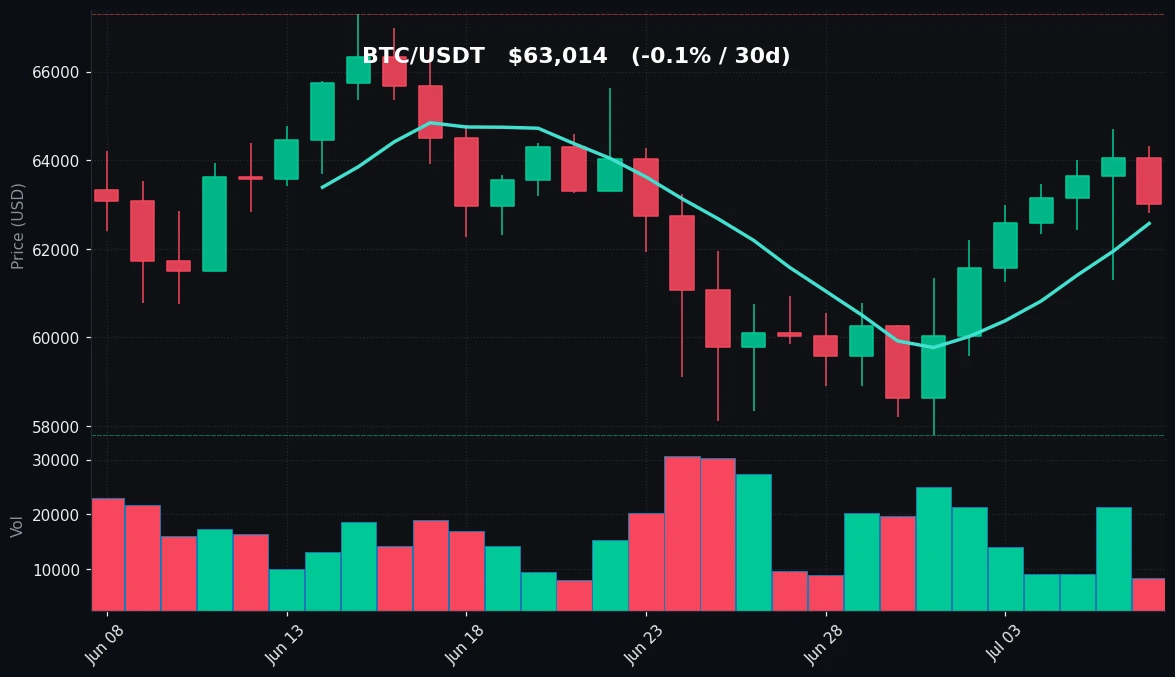
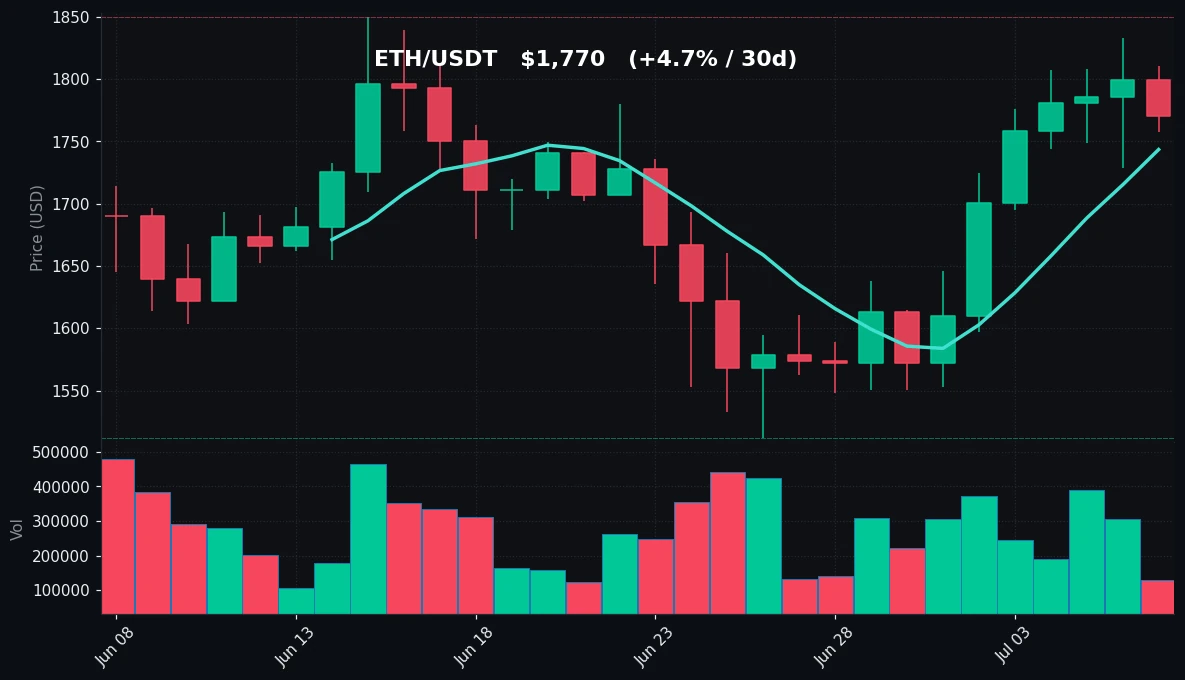
The crypto market opened the week with a mild pullback on July 7, as Bitcoin (BTC) and Ethereum (ETH) both recorded 24-hour losses of approximately 1.6%. BTC traded at $63,014 after touching a daily high of $64,314 and a low of $62,800, while ETH settled at $1,770 with a high of $1,810 and a low of $1,758. Despite the short-term dip, both assets remain in a constructive weekly posture. BTC has gained 7.49% over the past seven days, while ETH has outperformed with a 12.61% weekly advance. The 30-day picture shows BTC essentially flat at -0.11%, while ETH has added 4.72%. Volume for both assets was significantly below their 7-day averages (BTC at 0.49x, ETH at 0.45x), suggesting the pullback occurred on relatively low participation. The RSI readings are moderate: BTC at 51.1 (neutral) and ETH at 61.3 (slightly bullish), indicating no immediate overbought or oversold conditions. Key weekly ranges remain intact, with BTC’s 7-day high at $64,700 and low at $57,800, while ETH’s 7-day high stands at $1,833 and low at $1,553.
Bitcoin Analysis
TradingView Live (4h)
Bitcoin’s price action on July 7 reflects a consolidation phase following last week’s strong recovery from the $57,800 low. The asset opened the session near $63,500 and gradually drifted lower throughout the day, eventually settling at $63,014. The intraday range of $62,800 to $64,314 was relatively narrow compared to the 7-day high of $64,700, suggesting that sellers are defending the $64,500–$65,000 zone while buyers have established support near $62,800.
From a technical perspective, BTC is trading above both the 7-day moving average (MA7) at $62,574 and the 30-day moving average (MA30) at $62,620. The fact that the MA7 has crossed above the MA30 is a bullish signal, indicating that short-term momentum has turned positive. However, the 30-day high of $67,292 remains a significant resistance level, and the current price is roughly 6.4% below that peak.
Volume is a notable concern. Today’s trading volume was only 0.49 times the 7-day average, meaning activity is roughly half of what has been typical over the past week. This low-volume pullback is not inherently bearish—it often indicates that the move is driven by profit-taking rather than aggressive selling. However, it also suggests a lack of conviction among buyers to push prices higher in the immediate term.
The RSI(14) reading of 51.1 places BTC squarely in neutral territory. This is a healthy position because it leaves room for further upside without the risk of an overbought condition that might trigger a sharp reversal. The recent price action has formed a series of higher lows since the $57,800 bottom, and the $62,800–$63,000 zone appears to be acting as a new support level.
Key levels to watch include the $64,700 weekly high as immediate resistance. A break above this level with volume could open the path toward the $65,500–$66,000 zone. On the downside, a loss of the $62,800 support would expose the $62,000 area, which aligns with the MA30 and the previous consolidation zone from early July. The broader trend remains cautiously bullish, but the low volume today warrants attention—sustained low volume could lead to range-bound trading in the short term.
Ethereum Analysis
TradingView Live (4h)
Ethereum displayed relative strength compared to Bitcoin over the past week, gaining 12.61% versus BTC’s 7.49%. However, today’s 1.63% decline was nearly identical to BTC’s drop, indicating that the correlation remains high in the short term. ETH closed at $1,770 after touching a daily high of $1,810 and a low of $1,758. The 7-day high of $1,833 and 30-day high of $1,850 provide the next resistance targets.
The technical picture for ETH is more bullish than BTC on several fronts. First, ETH is trading comfortably above both its MA7 ($1,744) and MA30 ($1,687). The gap between price and the MA30 is approximately 4.9%, suggesting the uptrend has momentum. Second, the RSI(14) at 61.3 is in the mildly bullish zone but still well below the overbought threshold of 70. This indicates that ETH has room to run before reaching exhaustion.
Volume for ETH today was 0.45 times the 7-day average, even lower than BTC’s relative volume. This is consistent with a consolidation day where price action is driven by low-frequency traders and algorithmic adjustments rather than large directional bets. The weekly low of $1,553 and 30-day low of $1,512 are now well behind, and ETH has formed a clear uptrend channel since the June lows.
The $1,770 level is significant because it sits just above the psychological round number of $1,750 and below the recent resistance zone around $1,800–$1,833. The intraday high of $1,810 suggests that sellers are active near $1,800, which will be a critical level to watch in the coming sessions. If ETH can close above $1,800 with volume, it would likely trigger a test of the $1,833 weekly high and eventually the $1,850 30-day high.
On the downside, support is established at $1,744 (MA7), followed by $1,687 (MA30). A break below the MA7 would be the first sign of weakness, while a move below the MA30 would suggest the uptrend is losing momentum. Given the RSI at 61.3 and the positive MA crossover, the path of least resistance remains upward, but the low volume today indicates that a catalyst may be needed to break through resistance.
Key Technical Levels
| Asset | Support | Resistance | RSI |
|---|---|---|---|
| BTC | $62,800 | $64,700 | neutral (51.1) |
| ETH | $1,744 | $1,833 | mildly bullish (61.3) |
BTC vs ETH Dynamic
The correlation between Bitcoin and Ethereum remains high in the short term, with both assets posting nearly identical 24-hour declines of approximately 1.6%. However, over the past week, ETH has outperformed BTC by a margin of 5.12 percentage points (12.61% vs. 7.49%). This divergence is notable because it suggests that capital is rotating into Ethereum relative to Bitcoin, a pattern often associated with the early stages of altcoin season or increased confidence in the Ethereum ecosystem. The ETH/BTC ratio has risen from approximately 0.0280 one week ago to 0.0281 today, a modest but consistent gain. Over the 30-day period, ETH’s positive performance (+4.72%) contrasts with BTC’s flat performance (-0.11%), further highlighting relative strength. Despite this divergence, the daily correlation coefficient remains above 0.85, meaning that directional moves are still highly synchronized. The key difference is in the magnitude of moves—ETH is leading on the upside and may lead on the downside if a correction occurs. Traders should monitor the ETH/BTC ratio for signs of a trend reversal, as a sharp drop in the ratio could signal a return to BTC dominance.
Strategy Fit
Given the current market conditions—moderate volatility, neutral RSI, and low volume—the most suitable trading strategies are those that capitalize on range-bound movement while maintaining exposure to the broader uptrend.
Grid Trading: With BTC trading between $62,800 and $64,700 over the past week, a grid bot set within this range can capture profits from the small intraday oscillations. The low volume environment is ideal for grid strategies because sudden breakouts are less likely, and the price tends to revert to the mean. Pionex’s built-in grid trading bot allows users to set upper and lower price limits and automatically buy low and sell high. For ETH, a grid between $1,744 and $1,833 would be appropriate given the current support and resistance levels.
DCA (Dollar-Cost Averaging): For longer-term investors, the current neutral RSI and proximity to moving averages make DCA a viable strategy. Both BTC and ETH are trading near their 30-day moving averages, which historically have served as accumulation zones. Pionex’s DCA bot can be configured to buy fixed amounts at regular intervals, reducing the impact of short-term volatility. Given that BTC is essentially flat over 30 days, this is a favorable entry point for accumulation.
Trend Following: The 7-day trend is clearly bullish for both assets, but the low volume today suggests caution. A trend-following strategy could be employed with a stop-loss below the $62,800 support for BTC and $1,744 for ETH. Pionex’s trailing stop bot can help lock in profits as the trend develops while limiting downside risk. However, given the low volume, a breakout above $64,700 (BTC) or $1,833 (ETH) with confirmed volume would be the preferred trigger for trend-following entries.
Caution: The low volume environment reduces the reliability of technical breakouts. Traders should avoid aggressive leverage or large position sizes until volume returns to normal levels. The most prudent approach today is to use grid or DCA strategies that do not rely on directional conviction.
Risk Disclaimer
This market recap is provided for informational and educational purposes only. It does not constitute financial advice, investment recommendation, or solicitation to buy or sell any cryptocurrency. Past performance and historical data are not indicative of future results. Cryptocurrency markets are highly volatile and involve substantial risk of loss. You should conduct your own research and consult with a qualified financial advisor before making any investment decisions. The technical levels and strategies discussed are based on current market data and may change without notice. Trading bots and automated strategies do not guarantee profits and may result in losses. Never invest more than you can afford to lose.
FAQ
Q: Why did Bitcoin and Ethereum both drop about 1.6% today?
A: The decline appears to be a routine profit-taking move following last week’s strong gains. Volume was low (about half the 7-day average), suggesting the pullback is not driven by panic selling but rather by traders taking profits after BTC rose 7.49% and ETH rose 12.61% over the past seven days.
Q: What do the RSI readings of 51.1 for BTC and 61.3 for ETH indicate?
A: BTC’s RSI of 51.1 is neutral, meaning the asset is neither overbought nor oversold. ETH’s RSI of 61.3 is mildly bullish, indicating that buying pressure is slightly stronger than selling pressure. Neither reading suggests an imminent reversal, and both leave room for further upside.
Q: Is the low volume today a bearish signal?
A: Not necessarily. Low volume during a pullback often indicates that the move is driven by profit-taking rather than aggressive selling. However, if low volume persists as prices attempt to rally, it could signal a lack of buying conviction. Traders should watch for volume confirmation on any breakout above $64,700 (BTC) or $1,833 (ETH).
Q: What are the key support levels to watch if prices continue to fall?
A: For Bitcoin, the first major support is $62,800 (today’s low), followed by $62,574 (MA7) and $62,620 (MA30). A break below $62,000 would be concerning. For Ethereum, support is at $1,758 (today’s low), then $1,744 (MA7), and finally $1,687 (MA30).
Q: How can I use Pionex bots to trade these levels?
A: Pionex offers grid trading bots that can automatically buy at support and sell at resistance. For BTC, a grid between $62,800 and $64,700 is appropriate. For ETH, a grid between $1,744 and $1,833 works well. The DCA bot is also suitable for accumulating positions near moving averages. All bots can be configured with risk management parameters such as stop-loss limits.


