BTC ETH Daily Recap – July 5, 2026

BTC ETH Daily Recap – July 5, 2026
Today at a Glance
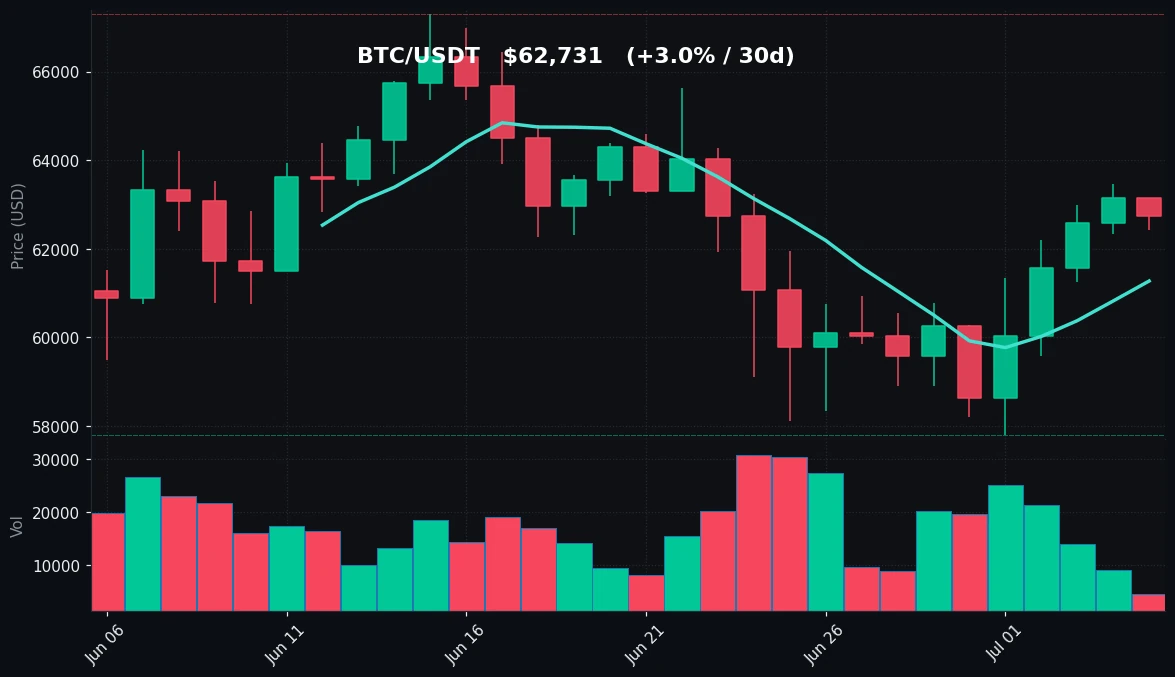
The crypto market on July 5, 2026, shows a mixed picture with Bitcoin and Ethereum trading in a narrow range. Bitcoin (BTC) is currently at $62,731, down 0.65% in the last 24 hours, with a session high of $63,144 and low of $62,437. Despite the slight daily decline, BTC maintains a positive weekly performance of +5.29%, though its 30-day gain is modest at +3.03%. The 7-day high of $63,462 remains near current levels, suggesting resistance is being tested. Volume is significantly below the 7-day average (0.27x), indicating low participation today.
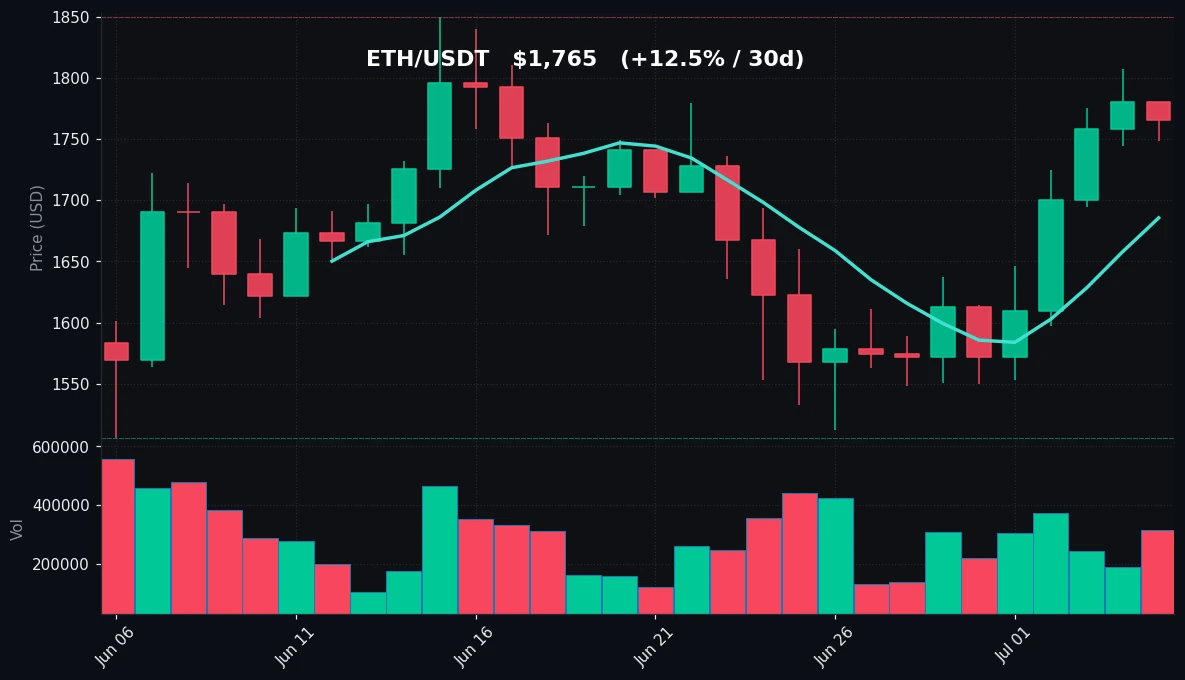
Ethereum (ETH) is trading at $1,765, also down 0.86% on the day, with a range of $1,749 to $1,781. However, ETH shows stronger momentum over the past week (+12.30%) and month (+12.46%), outperforming BTC in both timeframes. ETH’s volume is above the 7-day average (1.24x), reflecting sustained interest. Both assets are consolidating after recent gains, with BTC near its 30-day moving average and ETH above both its 7-day and 30-day MAs.
Bitcoin Analysis
TradingView Live (4h)
Bitcoin’s price action on July 5, 2026, reflects a consolidation phase following a strong weekly rally from the $57,800 low on June 28. The current price of $62,731 sits between the 7-day moving average (MA7) at $61,275 and the 30-day moving average (MA30) at $62,495. Notably, BTC is trading just above its MA30, a key level that often acts as dynamic support in uptrends. The 7-day high of $63,462 is a near-term resistance, while the 30-day high of $67,292 represents a more distant target.
Technical indicators suggest neutral-to-slightly-bearish momentum. The RSI(14) at 47.8 is below the 50 midline, indicating that selling pressure has been slightly dominant in the last 14 days, though not extreme. This reading is consistent with a market that is neither overbought nor oversold. The volume today is extremely low at 0.27x the 7-day average, signaling a lack of conviction from traders. Such low volume often precedes a breakout or breakdown, as thin liquidity can amplify price moves.
Key support levels to watch include the MA7 at $61,275, followed by the recent 7-day low of $57,800. On the upside, resistance is at $63,462 (7-day high) and $67,292 (30-day high). The price is currently oscillating within a tight range of about $700, which is narrow compared to the recent $5,662 range over the past week. This compression suggests that a directional move may be imminent, but the low volume makes it difficult to predict which way. The MA30 is acting as a pivot—holding above it could attract buyers, while a break below might lead to a test of lower supports.
Ethereum Analysis
TradingView Live (4h)
Ethereum is showing relative strength compared to Bitcoin, with a current price of $1,765 and a 24-hour range of $1,749 to $1,781. The asset has gained 12.30% over the past week and 12.46% over the past month, outperforming BTC’s 5.29% and 3.03% gains respectively. This suggests that capital is rotating into ETH, possibly driven by expectations of network upgrades or DeFi activity. The 7-day high of $1,808 and 30-day high of $1,850 are key resistance levels, while the 7-day low of $1,550 and 30-day low of $1,506 represent strong support.
Technically, ETH is in a bullish posture. The price is above both the MA7 ($1,686) and MA30 ($1,676), with the MA7 recently crossing above the MA30—a classic “golden cross” pattern that often signals the start of an uptrend. The RSI(14) at 55.8 is in neutral territory but above 50, indicating bullish momentum. Volume is elevated at 1.24x the 7-day average, confirming that the recent rally is supported by active participation.
The immediate support is at $1,749 (today’s low) and then the MA7 at $1,686. Resistance is at $1,808 (7-day high) and $1,850 (30-day high). The price has been consolidating near the $1,765 level after a strong rally from $1,550 on June 28. The consolidation is healthy, as it allows the market to absorb gains before the next move. If ETH can break above $1,808 with volume, it could target the $1,850 resistance. Conversely, a break below $1,749 may lead to a retest of the MA7 at $1,686. Given the volume profile, the path of least resistance appears upward, but the market remains sensitive to BTC’s direction.
Key Technical Levels
| Asset | Support | Resistance | RSI |
|---|---|---|---|
| BTC | $61,275 (MA7), $57,800 (7d low) | $63,462 (7d high), $67,292 (30d high) | Neutral (47.8) |
| ETH | $1,749 (24h low), $1,686 (MA7) | $1,808 (7d high), $1,850 (30d high) | Neutral (55.8) |
BTC vs ETH Dynamic
The correlation between Bitcoin and Ethereum remains high, with both assets showing similar intraday patterns—a slight decline on the day after a strong weekly performance. However, a notable divergence is emerging in relative strength. Ethereum has outperformed Bitcoin by a significant margin over the past 7 and 30 days, with gains of 12.30% and 12.46% compared to BTC’s 5.29% and 3.03%. This “ETH beta” is typical in crypto markets when altcoins catch up after Bitcoin leads the initial rally. The volume data supports this: ETH volume is above average, while BTC volume is below average, suggesting that traders are more actively engaged in ETH. The MA crossover (ETH MA7 above MA30) versus BTC’s price near its MA30 further reinforces that ETH has stronger short-term momentum. If this trend continues, ETH could be the leader in the next leg higher, but it remains dependent on BTC holding support.
Strategy Fit
Given the current market conditions—low volume on BTC, elevated volume on ETH, and neutral RSI readings—a range-bound strategy is most appropriate for today. For Bitcoin, the tight $700 range and low volume suggest that grid trading bots are well-suited. A grid bot on Pionex can profit from small price oscillations by placing buy orders near support ($61,275-$62,437) and sell orders near resistance ($63,144-$63,462). The neutral RSI (47.8) supports the idea that the market is not trending strongly, making grid strategies effective.
For Ethereum, the higher volume and bullish MA structure (MA7 above MA30) make a DCA (Dollar-Cost Averaging) or trend-following strategy more suitable. A spot grid bot with a wider range (e.g., $1,686 to $1,850) can capture volatility while managing risk. Alternatively, a trend trading bot that buys on pullbacks to the MA7 ($1,686) and sells at resistance ($1,808-$1,850) aligns with the current momentum. Pionex’s built-in bots, such as the Grid Trading Bot or Infinity Grid Bot, can automate these strategies without requiring constant monitoring. The low BTC volume suggests avoiding aggressive directional bets; instead, focus on capturing the range until a breakout occurs with volume confirmation.
Risk Disclaimer
This market recap is for informational and educational purposes only. It does not constitute financial advice, investment recommendations, or trading signals. Cryptocurrency markets are highly volatile and involve substantial risk of loss. Past performance is not indicative of future results. You should conduct your own research and consult with a qualified financial advisor before making any trading decisions. The technical analysis presented here is based on historical data and may not predict future price movements. Trading involves risk, and you should never invest more than you can afford to lose.
FAQ
Q: Why is Bitcoin volume so low today compared to the 7-day average?
A: Today’s volume is 0.27x the 7-day average, indicating reduced trading activity. Low volume often occurs during consolidation phases or before major news events. It can also reflect a lack of conviction from traders, making the market more susceptible to sudden price swings.
Q: What does the RSI of 47.8 mean for Bitcoin?
A: An RSI of 47.8 is neutral, meaning the asset is neither overbought (above 70) nor oversold (below 30). It suggests that selling pressure has been slightly dominant over the last 14 days, but not enough to signal a trend reversal.
Q: Is Ethereum’s performance a sign of an “alt season”?
A: Ethereum’s 12.30% weekly gain versus Bitcoin’s 5.29% does suggest capital rotation into ETH, which can be a precursor to a broader altcoin rally. However, one asset does not make an alt season. Watch for sustained volume and follow-through in other major altcoins.
Q: What are the key levels to watch for Bitcoin tomorrow?
A: The immediate support is $61,275 (MA7) and $62,437 (today’s low). Resistance is at $63,144 (today’s high) and $63,462 (7-day high). A break above $63,462 with volume could target $67,292, while a break below $61,275 may test $57,800.
Q: Which Pionex bot is best for current market conditions?
A: For Bitcoin’s low-volume range, a Grid Trading Bot with a range of $61,275 to $63,462 is suitable. For Ethereum’s higher-volume uptrend, a Spot Grid Bot with a range of $1,686 to $1,850 or a Trend Trading Bot that buys on pullbacks to MA7 can capture momentum. Always set stop-losses and manage risk.


