BTC ETH Daily Recap — 2026-08-02

BTC ETH Daily Recap — 2026-08-02
Today at a Glance
Bitcoin and Ethereum both posted modest intraday gains on August 2, 2026, as the broader crypto market continued to consolidate after a week of mild losses. BTC traded at $63,090, up 0.42% over the past 24 hours, while ETH edged higher by 0.49% to $1,854. However, the weekly picture remains negative: BTC is down 3.53% over seven days, and ETH has fallen 5.15% over the same period. Trading volumes have contracted sharply, with both assets trading at roughly one-third of their 7-day average volume, suggesting reduced participation and a wait-and-see stance among traders. Technical indicators are mixed—BTC’s RSI sits at 42.2 (neutral-to-bearish), while ETH’s RSI at 47.8 is closer to equilibrium. Short-term moving averages for both assets are slightly above current prices, indicating mild downward pressure. Neither asset has broken decisively out of its recent range, and the market appears to be building a base after last week’s pullback.
Bitcoin Analysis
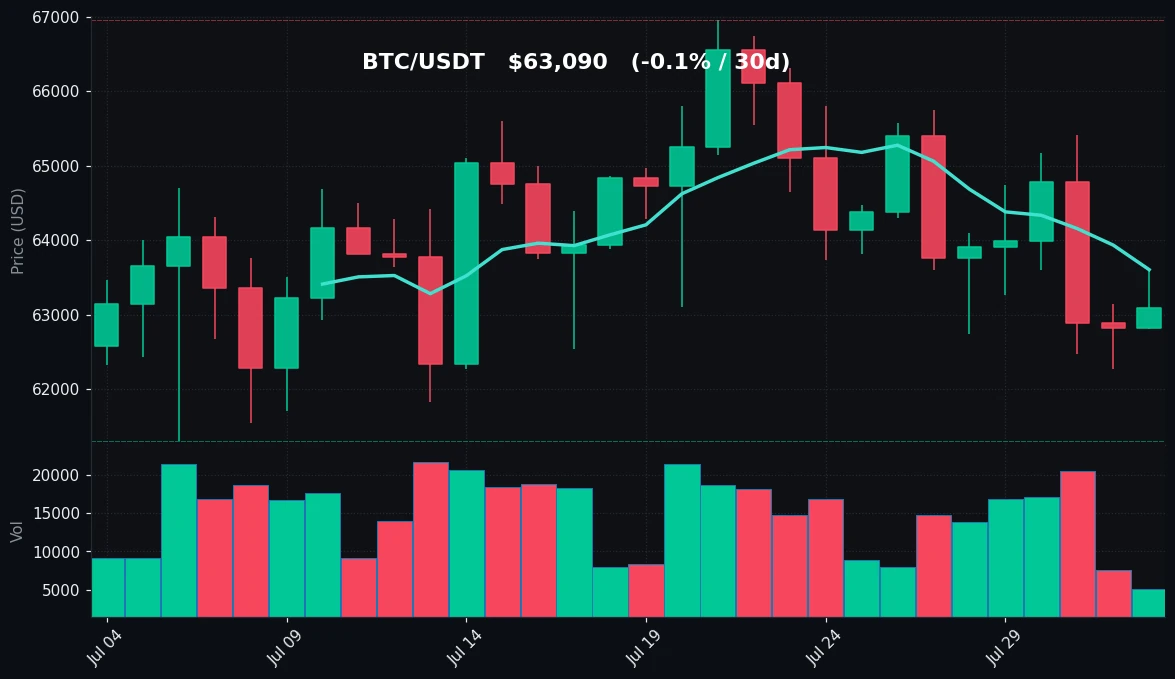
TradingView Live (4h)
Bitcoin is trading at $63,090, having ranged between $62,807 and $63,634 over the last 24 hours. The intraday move is modestly positive, but the weekly trend remains corrective. Over the past seven days, BTC has declined 3.53%, with a weekly high of $65,745 and a low of $62,275. The 30-day picture is essentially flat, with BTC down just 0.09% over the month, suggesting that the current pullback is a pause within a longer consolidation phase rather than a trend reversal.
The short-term moving averages reinforce this interpretation. The 7-day moving average (MA7) stands at $63,605, and the 30-day moving average (MA30) is $64,104. Both are above the current spot price, indicating that recent price action has been weaker than the recent average. However, the gap between price and MA30 is relatively narrow (about 1.6%), which suggests the market is not in a deep correction but rather in a shallow retracement.
The Relative Strength Index (RSI) at 42.2 is in neutral territory, slightly tilted toward the bearish side. An RSI below 50 typically indicates that sellers have a slight edge, but the reading is not extreme enough to signal oversold conditions. This leaves room for further downside, but also for a potential bounce if buyers step in near the $62,275–$62,800 support zone.
Volume data is notable: current volume is just 0.36x the 7-day average. This is a significant contraction. Low volume during a pullback often indicates that selling pressure is not aggressive—rather, the market is drifting lower on thin participation. This can be interpreted as a lack of conviction among sellers, which sometimes precedes a stabilization or reversal. However, it also means that any sharp move could be amplified due to thin liquidity.
Key levels to watch: immediate support sits at the weekly low of $62,275, with stronger support at the 30-day low of $61,307. On the upside, resistance is at MA7 ($63,605), followed by the weekly high of $65,745. A break above the latter would invalidate the short-term bearish structure. The current price action, combined with low volume and a neutral RSI, suggests that Bitcoin is in a wait-and-see mode, with neither bulls nor bears in full control.
Ethereum Analysis
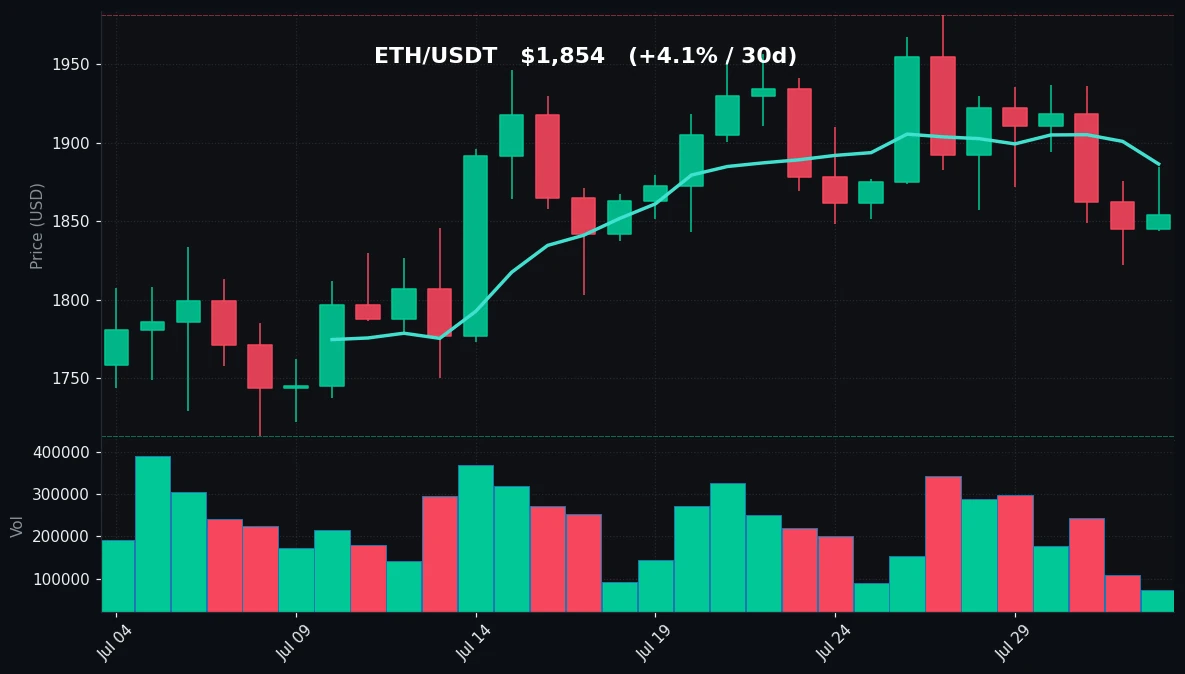
TradingView Live (4h)
Ethereum is trading at $1,854, up 0.49% on the day, with an intraday range of $1,844 to $1,885. The weekly performance is weaker than Bitcoin’s: ETH is down 5.15% over the past seven days, having fallen from a weekly high of $1,981 to a low of $1,822. Over the past 30 days, however, ETH is up 4.12%, outperforming BTC on the monthly scale. This suggests that the recent weekly decline is a correction within a broader uptrend, rather than the start of a new downtrend.
The moving average structure for ETH is slightly more nuanced. The MA7 is at $1,886, above the current price, indicating short-term weakness. The MA30 is at $1,853, which is just below the current price. This means that while the short-term trend is down, the medium-term trend is still marginally positive. The convergence of price and MA30 suggests that Ethereum is testing a critical juncture—if it holds above $1,853, the medium-term uptrend remains intact; if it breaks below, the picture weakens.
The RSI for ETH is 47.8, which is closer to the neutral 50 level than BTC’s reading. This indicates that ETH’s momentum is less bearish than BTC’s. The RSI is not showing any signs of overbought or oversold conditions, leaving room for movement in either direction.
Volume is similarly contracted, at 0.32x the 7-day average. This is a slightly deeper contraction than BTC’s. Low volume on the downside, as noted, often suggests that selling is not aggressive. For ETH, the recent weekly decline from $1,981 to $1,822 was sharp, but the fact that volume is now drying up could indicate that the selling wave has exhausted itself.
Key levels: immediate support is at the weekly low of $1,822, followed by the 30-day low of $1,713. On the upside, resistance is at the MA7 of $1,886, followed by the psychological $1,900 level and then the weekly high of $1,981. The current price action, sitting just above the MA30, makes this a pivotal moment for Ethereum’s short-term direction. A hold above $1,853 would likely attract buyers, while a breakdown below $1,822 would open the door to further downside.
Key Technical Levels
| Asset | Support | Resistance | RSI |
|---|---|---|---|
| BTC | $62,275 (weekly low) / $61,307 (30d low) | $63,605 (MA7) / $65,745 (weekly high) | Neutral (42.2) |
| ETH | $1,822 (weekly low) / $1,713 (30d low) | $1,886 (MA7) / $1,981 (weekly high) | Neutral (47.8) |
BTC vs ETH Dynamic
Bitcoin and Ethereum are showing a high degree of correlation in the current market environment, which is typical during consolidation phases. Both assets posted nearly identical daily gains (0.42% vs 0.49%) and both experienced similar weekly losses, though ETH’s decline was steeper (5.15% vs 3.53%). This divergence in weekly performance is notable: ETH fell harder during the pullback, which is consistent with its higher beta profile—Ethereum tends to amplify Bitcoin’s moves in both directions. However, on the 30-day timeframe, ETH is up 4.12% while BTC is flat, indicating that over the medium term, ETH has been the stronger performer. The RSI readings are also correlated, with both in neutral territory, though ETH’s reading (47.8) is slightly more constructive than BTC’s (42.2). The correlation suggests that macro factors, rather than asset-specific news, are currently driving both markets. Traders should monitor BTC’s behavior around $62,275–$63,600 as a leading indicator for ETH’s direction, given the historical tendency for BTC to lead ETH in both rallies and sell-offs.
Strategy Fit
Given the current market conditions—low volatility, contracting volume, and neutral RSI readings for both BTC and ETH—the environment is best suited for range-bound strategies rather than trend-following approaches. BTC is oscillating within a $62,275–$65,745 range, while ETH is trading between $1,822 and $1,981. Neither asset has shown the momentum required for a breakout strategy, and the declining volume suggests that a directional move is unlikely in the immediate term.
For traders looking to capitalize on this consolidation, grid trading strategies are particularly well-suited. A grid bot, such as those available on Pionex, can automatically place buy and sell orders at predetermined intervals within a set price range, profiting from the oscillations without requiring constant manual monitoring. Given the current ranges, a grid bot set between $62,000–$64,500 for BTC and $1,800–$1,950 for ETH could capture the expected volatility.
Alternatively, a DCA (Dollar-Cost Averaging) strategy is appropriate for investors with a longer time horizon. The market is neither in a clear uptrend nor a downtrend, and the low volume suggests that the current price levels may not be sustainable in either direction. DCA allows investors to accumulate positions over time, smoothing out entry prices and reducing the impact of short-term fluctuations. Pionex offers automated DCA bots that can be configured to buy at regular intervals, which is especially useful in a low-volatility, directionless market.
Trend-following strategies, on the other hand, are less suitable in the current environment. With RSI readings near neutral and prices hovering around moving averages, there is no clear trend to follow. Attempting to trade breakouts without confirmation could result in false signals and losses. It is prudent to wait for a decisive move above the weekly highs or below the weekly lows before deploying trend-based strategies. Until then, grid and DCA approaches offer the most favorable risk-reward profile.
Risk Disclaimer
This market recap is provided for informational and educational purposes only and does not constitute financial advice, investment advice, trading advice, or any other sort of advice. Cryptocurrency markets are highly volatile and involve substantial risk of loss. You should not treat any opinion expressed in this report as a specific inducement to make any investment or follow any strategy, but only as an expression of opinion. Past performance is not indicative of future results. The data and analysis presented here are based on information available at the time of writing and may become outdated or inaccurate. Always conduct your own research and consult with a qualified financial advisor before making any investment decisions. Trading cryptocurrencies involves risk, and you could lose all of your invested capital. Neither the author nor any affiliated entity accepts any liability for any loss or damage arising from reliance on the information contained in this report.
FAQ
What is the current RSI for Bitcoin and what does it indicate?
Bitcoin’s RSI (14) is 42.2, which is in neutral territory but slightly tilted toward the bearish side. An RSI below 50 generally indicates that sellers have a slight edge, but the reading is not extreme enough to signal oversold conditions. This suggests that BTC has room to move in either direction without being constrained by momentum extremes.
Why is trading volume so low today?
Both BTC and ETH are trading at roughly one-third of their 7-day average volume. Low volume during a consolidation phase often indicates reduced participation and a lack of conviction among traders. This can lead to amplified price moves if a breakout occurs, but it also means that the current range-bound behavior is likely to persist until volume picks up.
What are the key support levels for Ethereum?
Ethereum’s immediate support is at the weekly low of $1,822, followed by the 30-day low of $1,713. The MA30 at $1,853 also acts as a psychological support level, as the price is currently hovering just above it. A break below $1,822 would open the door to further downside toward $1,713.
How does the BTC vs ETH correlation affect trading?
The high correlation between BTC and ETH means that moves in one asset are likely to be mirrored in the other. This is useful for risk management—if BTC breaks down, ETH is likely to follow, and vice versa. Traders can use BTC’s price action as a leading indicator for ETH, given BTC’s historical tendency to lead the market.
Is now a good time to start a grid trading bot?
Given the current low-volatility, range-bound market, grid trading can be an effective strategy. Both BTC and ETH are trading within well-defined ranges, and the low volume suggests that these ranges are likely to persist in the short term. A grid bot can profit from these oscillations. However, it is important to set the grid boundaries appropriately based on the current support and resistance levels to avoid being caught in a breakout.


