BTC ETH Daily Recap – July 12, 2026

BTC ETH Daily Recap – July 12, 2026
Today at a Glance
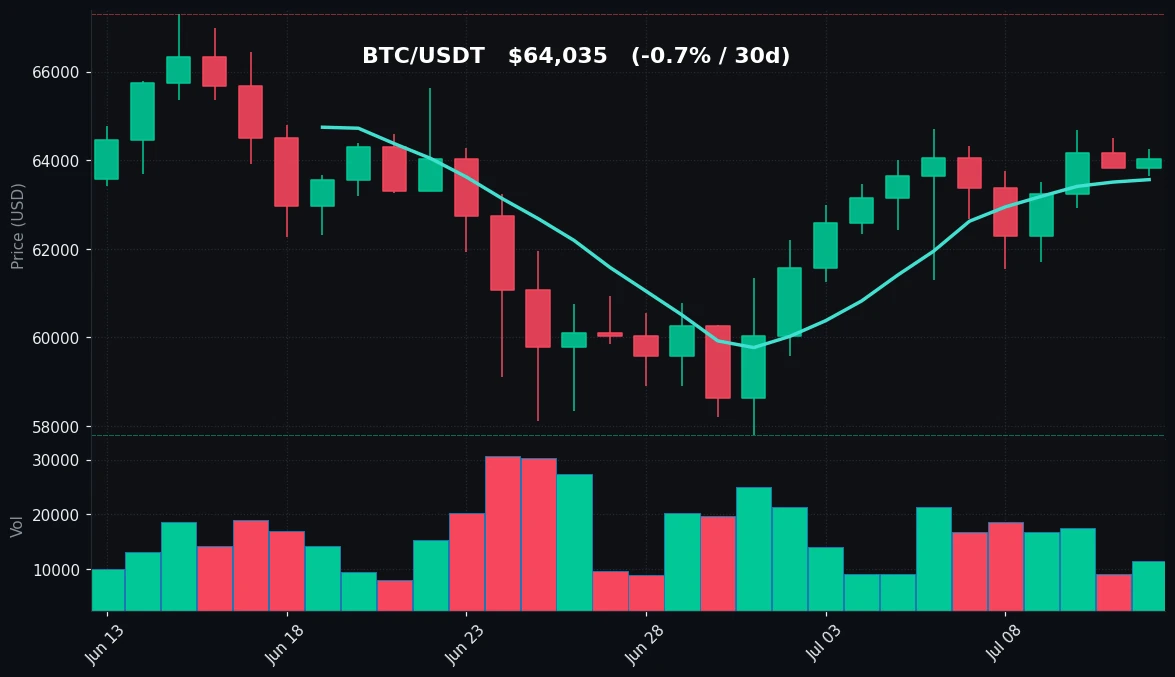
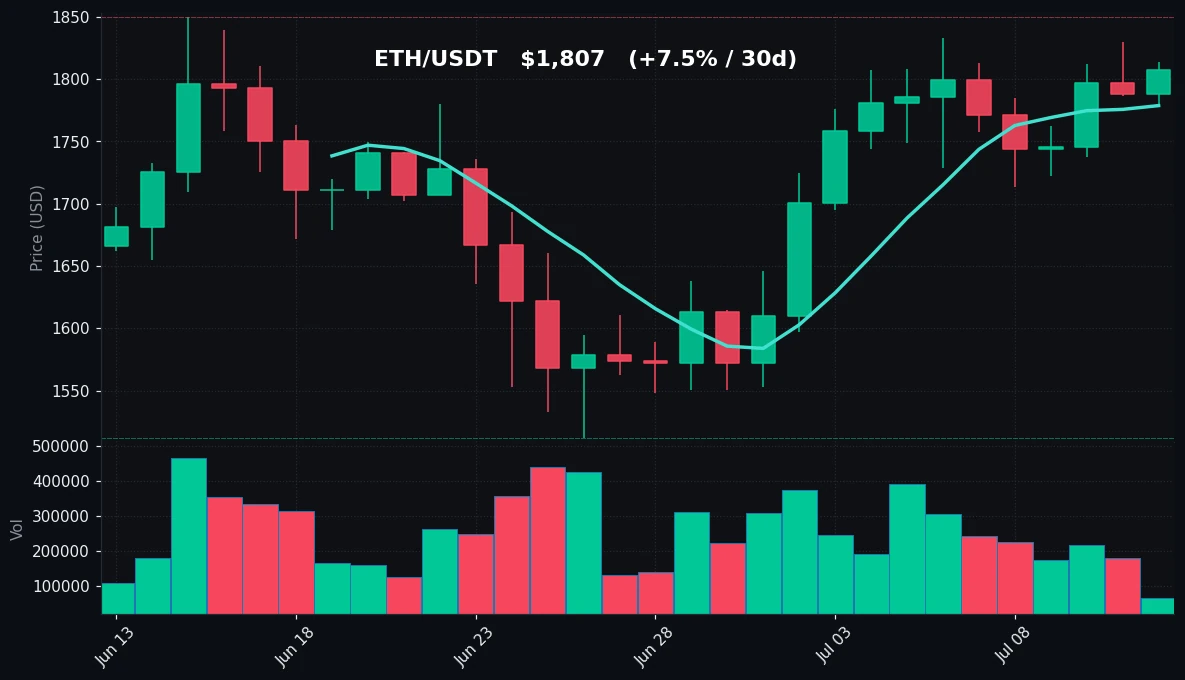
The crypto market showed a calm but slightly positive session on July 12, 2026, with Bitcoin (BTC) edging up 0.34% to $64,035, while Ethereum (ETH) posted a stronger 1.08% gain to $1,807. BTC’s intraday range remained narrow—between $63,641 and $64,246—indicating a period of consolidation after last week’s swing low near $61,307. ETH continued its relative outperformance, rising 1.20% over the past seven days and 7.48% over the past 30 days, supported by a bullish RSI reading of 76.3. Volume for both assets fell below their 7-day averages—BTC at 0.73x and ETH at 0.26x—suggesting reduced participation and a lack of directional conviction. BTC’s moving averages (MA7: $63,563, MA30: $62,765) remain in a bullish alignment, while ETH’s shorter-term MA7 ($1,779) sits above its MA30 ($1,707), confirming a near-term uptrend. The overall market tone is cautious yet constructive, with no major catalyst driving broad-based moves.
Bitcoin Analysis
TradingView Live (4h)
Bitcoin is trading at $64,035, up 0.34% over the past 24 hours, with a daily high of $64,246 and a low of $63,641. The asset has recovered from a 7-day low of $61,307, which was tested on July 9, and is now consolidating below the 7-day high of $64,700. The 7-day moving average (MA7) stands at $63,563, while the 30-day moving average (MA30) is at $62,765—both acting as dynamic support levels. The MA7/MA30 spread of approximately $798 indicates a bullish short-term trend, though the pace of ascent has slowed.
Key technical levels to watch include the $64,700 resistance, which capped the recent recovery attempt on July 8. A break above this level would open the path toward the 30-day high of $67,292. On the downside, immediate support lies at $63,563 (MA7), followed by the MA30 at $62,765. The 30-day low of $57,800 remains a distant floor, but a breach of $61,307 would signal a re-test of that zone.
The Relative Strength Index (RSI-14) is at 68.7, just below the overbought threshold of 70. This suggests bullish momentum remains intact but is not yet extreme, leaving room for further upside without immediate exhaustion risk. Volume is running at 0.73x the 7-day average, indicating low participation—typical of a consolidation phase. Without a volume catalyst, BTC is likely to remain range-bound between $63,500 and $64,700 in the near term.
Ethereum Analysis
TradingView Live (4h)
Ethereum is trading at $1,807, up 1.08% in the last 24 hours, with a daily high of $1,814 and a low of $1,779. The asset has shown stronger relative performance, gaining 1.20% over the past week and 7.48% over the past 30 days. ETH’s 7-day high of $1,833 and 30-day high of $1,850 are key resistance levels, while the 7-day low of $1,713 and 30-day low of $1,512 serve as support floors.
The moving averages are in a bullish configuration: MA7 at $1,779 and MA30 at $1,707. The MA7 is currently providing dynamic support, with the price trading above it. The spread between MA7 and MA30 is $72, reflecting a healthy but not overextended uptrend. ETH has been steadily climbing from its 30-day low of $1,512, which was reached on June 12, and has now recovered over 19% from that level.
The RSI-14 stands at 76.3, which is in overbought territory (above 70). This suggests that buying pressure has been strong, but it also raises the risk of a short-term pullback or consolidation. However, in strong trends, overbought readings can persist. Volume is notably low at 0.26x the 7-day average, indicating that the recent price advance is occurring on thin liquidity. This could make ETH more susceptible to volatility if a catalyst appears.
Key resistance is at $1,833 (7-day high) and $1,850 (30-day high). A break above $1,850 would mark a new monthly high and could accelerate buying. Support is at $1,779 (MA7) and $1,713 (7-day low). A drop below $1,713 would negate the short-term uptrend.
Key Technical Levels
| Asset | Support | Resistance | RSI |
|---|---|---|---|
| BTC | $63,563 (MA7), $62,765 (MA30) | $64,700 (7d high), $67,292 (30d high) | 68.7 – neutral, near overbought |
| ETH | $1,779 (MA7), $1,713 (7d low) | $1,833 (7d high), $1,850 (30d high) | 76.3 – overbought |
BTC vs ETH Dynamic
In the past 24 hours, Ethereum has outperformed Bitcoin by a margin of 0.74 percentage points (1.08% vs 0.34%). This divergence is notable, as ETH’s 30-day gain of 7.48% far exceeds BTC’s slight decline of 0.66% over the same period. The ETH/BTC ratio has therefore been rising, indicating capital rotation from BTC to ETH. However, the low volume on ETH (0.26x average) suggests that this move is not yet broadly supported by new inflows. Correlation between the two assets remains high in terms of direction, but the magnitude of ETH’s recovery from its 30-day low ($1,512) is significantly stronger than BTC’s from its low ($57,800). This could signal that traders are favoring ETH on relative strength, but the overbought RSI on ETH warrants caution. If BTC fails to break above $64,700, it may pull ETH lower as well.
Strategy Fit
Given the current market conditions—low volume, narrow ranges, and mixed momentum signals—a conservative approach is warranted. Bitcoin’s RSI near 68.7 and ETH’s overbought reading of 76.3 suggest that chasing breakout moves carries elevated risk of whipsaw. A grid trading strategy is well-suited for this environment, as it profits from range-bound price action without requiring directional conviction. For BTC, a grid between $63,500 and $64,700 (the recent 7-day range) can capture small price oscillations. For ETH, a grid between $1,770 and $1,830 (around MA7 and 7-day high) would align with the current consolidation zone.
Alternatively, DCA (dollar-cost averaging) remains a low-risk approach for longer-term accumulation, especially given that both assets are above their 30-day moving averages but not at extreme highs. Trend-following strategies are less favorable today due to the volume deficit and lack of clear breakout momentum. Platforms like Pionex offer built-in grid trading bots and DCA bots that can automate these strategies, allowing traders to capture small profits without constant monitoring. For those seeking higher risk, a breakout strategy could be considered if BTC closes above $64,700 or ETH above $1,850, but current data does not support such a move.
Risk Disclaimer
This market recap is for educational and informational purposes only. It does not constitute financial advice, investment recommendations, or solicitation to buy or sell any digital assets. Cryptocurrency markets are highly volatile and involve substantial risk of loss. Past performance is not indicative of future results. Always conduct your own research and consult with a qualified financial advisor before making any trading decisions. The author and platform may hold positions in the assets discussed.
FAQ
What is Bitcoin’s current RSI and what does it indicate?
Bitcoin’s 14-day RSI is 68.7, which is just below the overbought threshold of 70. This indicates that bullish momentum is present but not extreme, leaving room for further upside if volume picks up. However, it also suggests the asset is approaching a zone where short-term pullbacks can occur.
Why is Ethereum’s volume so low despite its price increase?
ETH’s volume is at 0.26x its 7-day average, meaning trading activity is significantly lower than typical. This suggests that the recent price advance is driven by a small number of participants or algorithmic trading, rather than broad market participation. Low volume can lead to sharp but unsustainable moves.
What are the key support and resistance levels for BTC today?
The key support levels are $63,563 (7-day moving average) and $62,765 (30-day moving average). Resistance is at $64,700 (7-day high) and $67,292 (30-day high). A break above $64,700 would signal a resumption of the uptrend.
Is Ethereum overbought and should I sell?
Ethereum’s RSI of 76.3 is in overbought territory, which historically can precede a short-term pullback or consolidation. However, in strong uptrends, overbought conditions can persist. Selling based solely on RSI is not recommended; consider using stop-losses or grid strategies to manage risk.
What trading strategy fits today’s market conditions?
A grid trading strategy is most suitable due to the low volume and narrow ranges. For BTC, a grid between $63,500 and $64,700 can capture small oscillations. For ETH, a grid between $1,770 and $1,830 aligns with current support/resistance. DCA is also a low-risk option for longer-term holders.


