BTC ETH Daily Recap: August 5, 2026 — Consolidation Persists as Volatility Compresses

BTC ETH Daily Recap: August 5, 2026 — Consolidation Persists as Volatility Compresses
Today at a Glance
The cryptocurrency market on August 5, 2026, presented a picture of tight consolidation, with both Bitcoin and Ethereum trading in narrow intraday ranges. Bitcoin (BTC) displayed marginal resilience, posting a 24-hour gain of +0.39% to settle at $64,354. The asset oscillated between a low of $63,880 and a high of $64,581, reflecting a compressed trading band that suggests indecision among market participants. Over the broader weekly and monthly horizons, BTC has maintained a modest positive trajectory, with gains of +0.58% and +1.56% respectively. Ethereum (ETH) mirrored this subdued sentiment, edging up +0.33% over the last 24 hours to $1,876, though its weekly performance dipped -1.82%. Notably, ETH’s 30-day change remains strongly positive at +5.89%, indicating underlying medium-term strength. Trading volumes have contracted significantly—BTC at 0.49x its 7-day average and ETH at 0.63x—underscoring a market in a wait-and-see mode. Both assets’ RSI readings (BTC: 40.7, ETH: 43.2) remain in neutral territory, suggesting neither overbought nor oversold conditions.
Bitcoin Analysis
TradingView Live (4h)
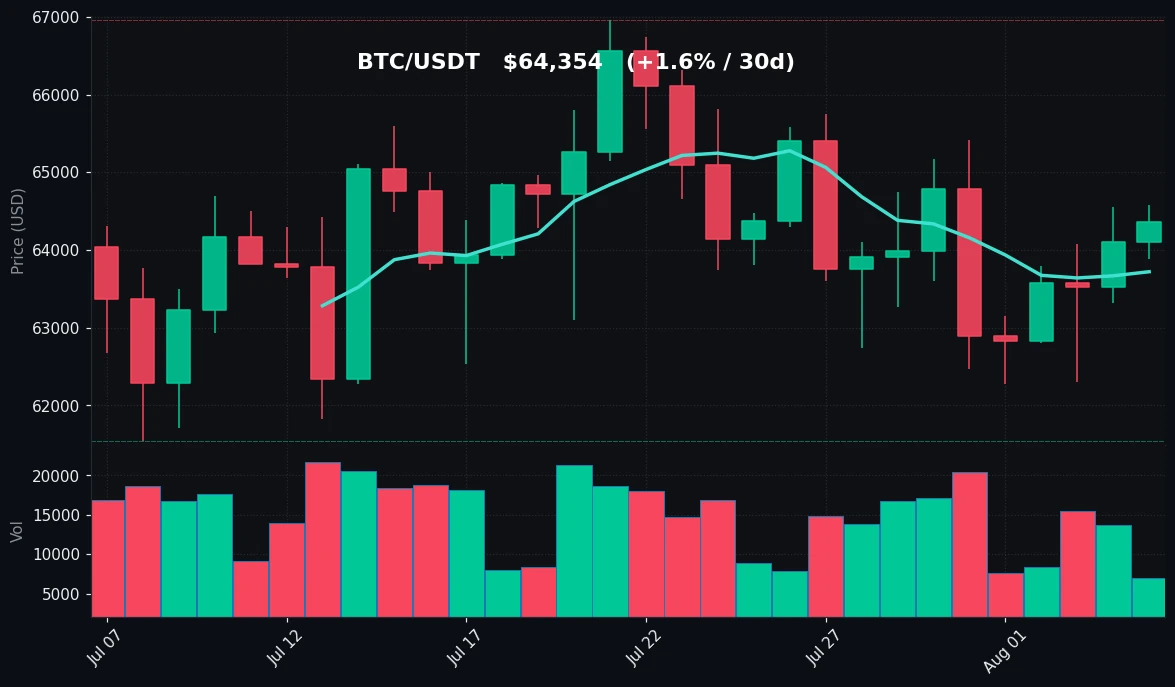
Bitcoin’s price action on August 5, 2026, is best characterized as a period of low-volatility consolidation within a well-defined range. The daily session saw BTC trade between $63,880 and $64,581, with the closing price of $64,354 representing a slight recovery from the session’s lower boundary. This intraday range of approximately $700 is notably narrow, reflecting a market that lacks directional conviction.
Examining the longer-term structure, BTC has been oscillating within a broader band defined by its 30-day high of $66,956 and low of $61,545. The current price sits comfortably in the middle of this range, having failed to establish a decisive break in either direction. Over the past week, the asset has traded between $62,275 and $65,410, with the current price residing in the upper half of that weekly range. This positioning suggests that while buyers have managed to defend recent lows, they have also been unable to push prices toward the weekly high with any sustainable momentum.
Technical indicators offer a mixed but generally neutral picture. The 7-day moving average (MA7) stands at $63,720, while the 30-day moving average (MA30) is at $64,158. Bitcoin’s current price of $64,354 sits above both moving averages, a structurally positive signal. However, the proximity of the price to the MA30 indicates that this support level is being tested. The gap between the short-term and medium-term moving averages is relatively narrow, suggesting that the market has been range-bound for an extended period without establishing a clear trend.
The Relative Strength Index (RSI) at 40.7 places Bitcoin in neutral territory, below the 50 midpoint but well above oversold conditions (typically below 30). This reading implies that selling pressure has been present but not overwhelming. The RSI trajectory over recent sessions has been relatively flat, confirming the absence of strong momentum in either direction.
Volume data provides crucial context for the current price action. Trading volume stands at 0.49x the 7-day average, indicating a significant contraction in market participation. This volume profile is consistent with a consolidation phase, where reduced liquidity often leads to tighter ranges and increased susceptibility to sharp moves when volume eventually returns. The lack of volume behind recent price movements suggests that neither bulls nor bears have committed significant capital to establish a directional trend.
Key technical levels to monitor include immediate support at the $63,880 daily low, followed by the MA7 at $63,720 and the weekly low of $62,275. On the upside, resistance is visible at the $64,581 daily high, followed by the $65,410 weekly high. A sustained break above the weekly high would be required to challenge the 30-day high of $66,956. Conversely, a loss of the $62,275 level would open the path toward the 30-day low of $61,545.
Ethereum Analysis
TradingView Live (4h)
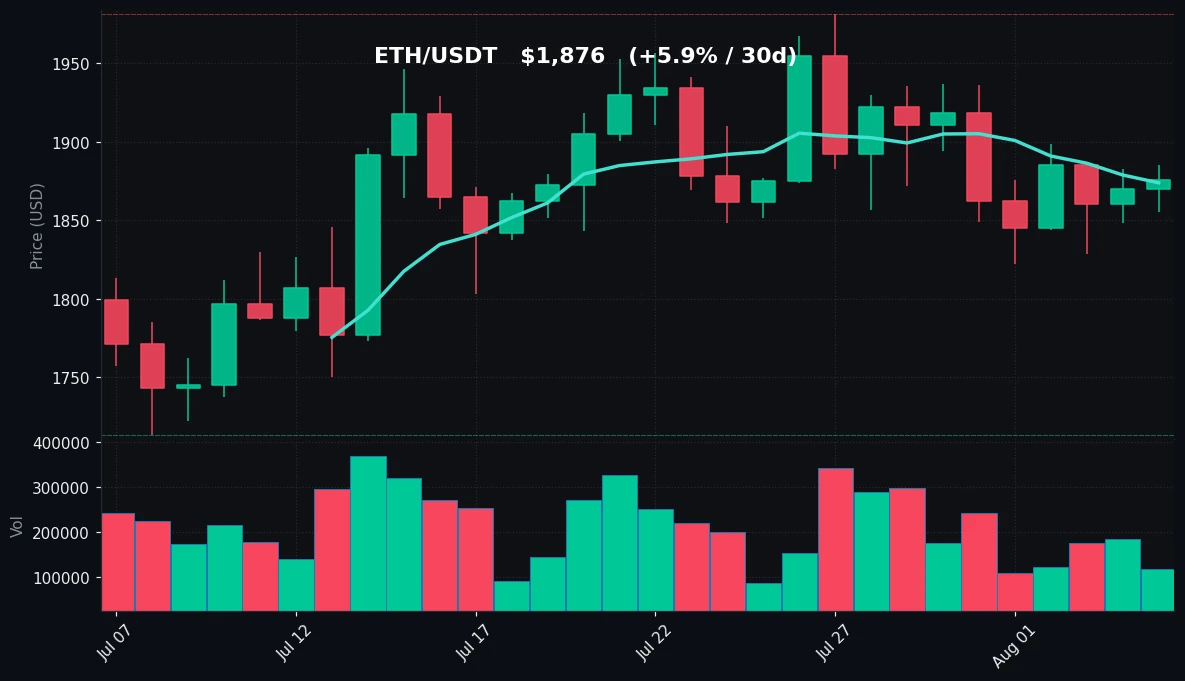
Ethereum’s trading session on August 5, 2026, exhibited characteristics similar to Bitcoin, with price action confined to a narrow range. ETH traded between $1,856 and $1,885, closing at $1,876—a marginal gain of +0.33% on the day. The intraday range of approximately $29 represents one of the tightest trading bands observed in recent weeks, highlighting the market’s subdued risk appetite.
The medium-term picture for Ethereum reveals a more dynamic story than its recent daily action suggests. While the 24-hour change was negligible, the 30-day performance shows a robust +5.89% gain, indicating that ETH has been one of the better-performing major assets over the past month. The asset’s 30-day range spans from a low of $1,713 to a high of $1,981, with the current price positioned closer to the upper end of this range. This positioning reflects the asset’s relative strength over the medium term, even as short-term momentum has stalled.
However, the weekly performance tells a slightly different story. ETH is down -1.82% over the past seven days, having traded between $1,822 and $1,937. The current price of $1,876 sits in the middle of this range, suggesting that the recent pullback from the weekly high has been partially retraced but not fully recovered. This pattern of lower weekly performance contrasted with strong monthly gains indicates that Ethereum may be undergoing a period of short-term correction within a broader uptrend.
From a technical standpoint, Ethereum’s moving averages present a supportive picture. The MA7 at $1,874 and MA30 at $1,862 are both below the current price, and the MA7 is positioned above the MA30—a configuration typically associated with a bullish short-term structure. The fact that the price has held above both moving averages, despite the weekly decline, suggests that underlying demand remains intact. However, the narrow gap between the two moving averages indicates that the market has been consolidating, and a directional move may be approaching.
The RSI for Ethereum stands at 43.2, slightly higher than Bitcoin’s reading but still firmly in neutral territory. This reading suggests that the recent price decline has not generated excessive selling pressure, and the asset retains room for upward movement without becoming overbought. The RSI’s position below the 50 midpoint does indicate a slight bearish tilt in short-term momentum, but the magnitude of this tilt is not significant.
Volume analysis for ETH reveals a contraction to 0.63x the 7-day average, which, while reduced, is less severe than Bitcoin’s volume decline. This suggests that Ethereum has maintained relatively better market participation during the consolidation phase. The reduced volume accompanying the recent price stabilization could indicate that selling pressure is abating, as fewer sellers are willing to transact at current levels.
Key levels for Ethereum include support at the $1,856 daily low, followed by the MA30 at $1,862 and the weekly low of $1,822. More substantial support lies at the $1,713 monthly low. On the resistance side, the $1,885 daily high and $1,937 weekly high represent immediate hurdles, with the $1,981 monthly high as the next significant level. The proximity of the current price to both the MA7 and MA30 suggests that a decisive move beyond the daily range could trigger a more substantial directional move.
Key Technical Levels
| Asset | Support | Resistance | RSI |
|---|---|---|---|
| BTC | $62,275 | $65,410 | Neutral (40.7) |
| ETH | $1,822 | $1,937 | Neutral (43.2) |
BTC vs ETH Dynamic
The relationship between Bitcoin and Ethereum on August 5, 2026, reflects a high degree of correlation, with both assets trading in narrow ranges and exhibiting similar percentage changes over the 24-hour period. BTC’s +0.39% and ETH’s +0.33% daily moves are nearly identical, underscoring the synchronized nature of the broader market. However, notable divergences exist in their medium-term performance. Ethereum’s 30-day gain of +5.89% substantially outperforms Bitcoin’s +1.56%, suggesting that ETH has been the relative outperformer during the recent consolidation phase. Conversely, Bitcoin’s weekly performance (+0.58%) is stronger than Ethereum’s (-1.82%), indicating that BTC has shown greater short-term resilience. These differing trajectories suggest that while the assets remain highly correlated on a daily basis, sector-specific factors may be influencing their medium-term paths. The relative strength of Ethereum over the monthly timeframe could reflect increasing activity in the broader Ethereum ecosystem, while Bitcoin’s weekly stability may indicate its continued role as a store of value during uncertain periods.
Strategy Fit
The current market environment, characterized by low volatility, compressed trading ranges, and reduced volume, presents specific considerations for trading strategy selection. For both BTC and ETH, the narrow daily ranges and neutral RSI readings suggest that directional trend-following strategies may generate limited opportunities in the immediate term. The absence of clear momentum in either direction argues against aggressive breakout strategies, as false signals are more likely during low-volatility phases.
Grid trading strategies appear particularly well-suited to the current conditions. With BTC trading in a defined range between $62,275 and $65,410, and ETH between $1,822 and $1,937, grid bots can capitalize on the oscillation within these established boundaries. The Pionex grid trading bot is designed to automate this approach, placing buy and sell orders at predetermined intervals to profit from price fluctuations within a range. The current consolidation phase, with its predictable support and resistance levels, provides an ideal environment for such strategies.
Dollar-cost averaging (DCA) strategies also remain viable, particularly given the neutral technical outlook. The Pionex DCA bot allows investors to systematically accumulate positions over time, mitigating the impact of short-term price uncertainty. This approach is particularly appropriate when RSI readings suggest neither overbought nor oversold conditions, as it avoids the need to time entry points precisely.
Trend-following strategies may be less effective in the current environment. The narrow ranges and lack of directional momentum reduce the profitability of breakout or momentum-based approaches. However, traders should remain alert to the possibility of an eventual range expansion, as the compressed volatility and reduced volume often precede significant moves. In such scenarios, having a predefined plan for both breakout and breakdown scenarios is essential.
Risk Disclaimer
This market recap is provided for informational and educational purposes only and does not constitute financial advice, investment advice, trading advice, or any other form of professional advice. Cryptocurrency markets are highly volatile and involve substantial risk of loss. Past performance is not indicative of future results. The information presented here is based on data available as of August 5, 2026, and may become outdated or inaccurate. You should conduct your own research and consult with a qualified financial advisor before making any investment decisions. Never invest more than you can afford to lose, and be aware that the value of digital assets can fluctuate dramatically. The author and publisher of this content are not liable for any losses or damages arising from actions taken based on the information provided.
FAQ
What was Bitcoin’s price on August 5, 2026?
Bitcoin closed at $64,354 on August 5, 2026, representing a 24-hour gain of +0.39%. The asset traded within a range of $63,880 to $64,581 during the day.
How did Ethereum perform on August 5, 2026?
Ethereum closed at $1,876, up +0.33% over the previous 24 hours. Its daily trading range was between $1,856 and $1,885.
Are Bitcoin and Ethereum showing overbought or oversold conditions?
Neither asset is showing extreme conditions. Bitcoin’s RSI is 40.7, and Ethereum’s RSI is 43.2. Both readings are in neutral territory, indicating balanced buying and selling pressure.
What are the key support levels to watch for BTC and ETH?
For Bitcoin, key support is at the weekly low of $62,275, followed by the 30-day low of $61,545. For Ethereum, support is at the weekly low of $1,822, with stronger support at the monthly low of $1,713.
Is the current low volume a concern for traders?
Reduced volume, with BTC at 0.49x and ETH at 0.63x their respective 7-day averages, indicates lower market participation. While this can lead to tighter trading ranges, it also suggests that the market may be building toward a more significant move when volume returns. Traders should be prepared for potential volatility expansion.


