BTC ETH Daily Recap — 2026-08-07

BTC ETH Daily Recap — 2026-08-07
Today at a Glance
Bitcoin and Ethereum both posted modest gains on August 7, 2026, continuing a constructive weekly trend. BTC/USDT rose 1.04% over the past 24 hours to settle at $64,991, while ETH/USDT gained 0.92% to $1,922. Both assets traded within a narrow intraday range, with BTC touching a daily high of $65,391 and ETH reaching $1,943. Notably, the 7-day performance shows synchronized strength: BTC is up 3.34% and ETH up 3.17% over the week, suggesting broad market participation rather than asset-specific catalysts. ETH’s 30-day gain of 10.11% outpaces BTC’s 2.78%, reflecting relatively stronger momentum in the altcoin leader. Volume, however, remains subdued — BTC traded at 0.61x its 7-day average volume and ETH at 0.78x — indicating that the current advance is occurring on thinner liquidity. Both assets remain above their 7-day and 30-day moving averages, with RSI readings in neutral territory (BTC: 54.8, ETH: 57.3), leaving room for further movement without immediate overbought conditions.
Bitcoin Analysis
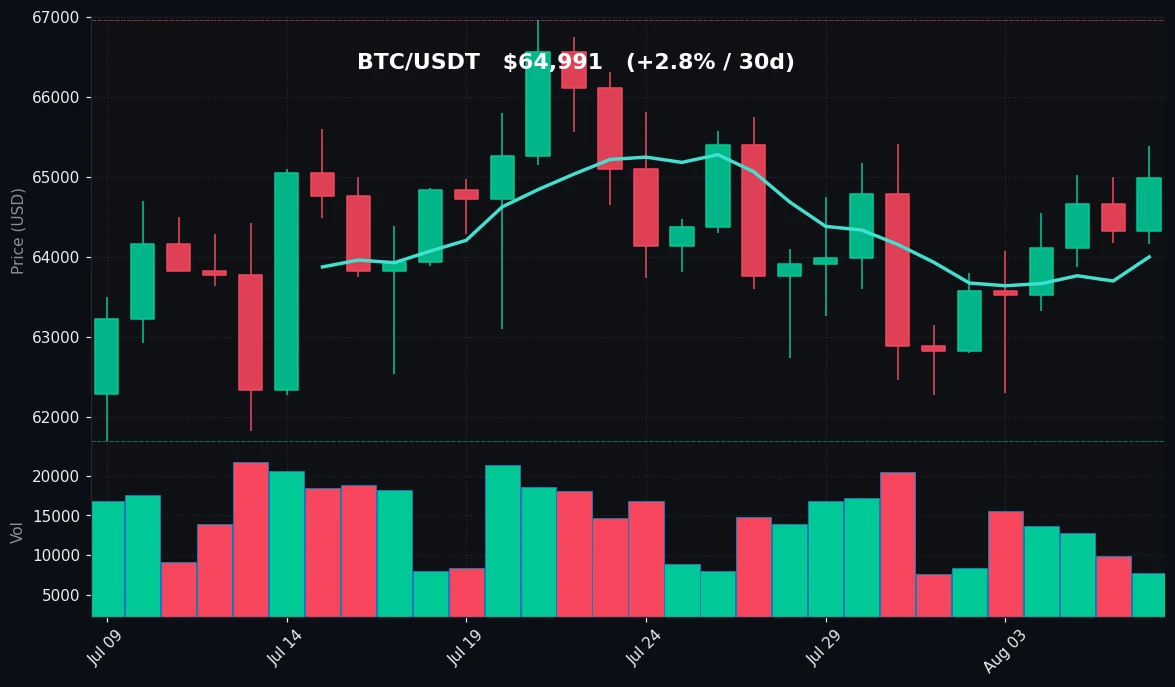
TradingView Live (4h)
Bitcoin is trading at $64,991, up 1.04% in the last 24 hours, with a daily range of $64,166 to $65,391. The asset closed the previous week near $62,800 and has since climbed steadily, establishing a 7-day high of $65,391 — just $565 above the current price. The 30-day high stands at $66,956, set roughly three weeks ago, while the 30-day low of $61,705 marks the key downside reference.
From a technical perspective, BTC is positioned above both its 7-day moving average (MA7: $64,000) and 30-day moving average (MA30: $64,290). The price has held above these levels for the past four sessions, which indicates that short-term momentum remains constructive. However, the gap between the current price and the MA30 is only about $700 (roughly 1.1%), suggesting that the trend is not strongly overextended in either direction. The MA7 crossing above the MA30 earlier this week is a positive short-term signal, though the convergence of these averages near $64,000–$64,300 also marks a potential support cluster.
The RSI(14) sits at 54.8, which is comfortably in neutral territory. This reading implies that neither buyers nor sellers have established decisive control. Historically, BTC has shown that RSI values between 50 and 60 during an uptrend often precede continued consolidation or gradual appreciation rather than sharp moves. The current RSI does not indicate exhaustion, nor does it suggest that the asset is oversold.
Volume analysis reveals a notable divergence: BTC is trading at 0.61x its 7-day average volume. This means that the recent price increase has occurred on declining participation. Low-volume advances are often viewed with caution, as they may lack the institutional backing required for sustained breakouts. The 24-hour high of $65,391 was tested but not decisively breached, and the failure to push through this level on reduced volume could signal that sellers are active near $65,400.
Key support is identified at $64,000 (the MA7 and psychological level) and further at $62,275 (the 7-day low). On the upside, resistance sits at $65,391 (recent high) and $66,956 (30-day high). The price action over the next sessions will likely depend on whether volume returns to support a move beyond $65,400.
Ethereum Analysis
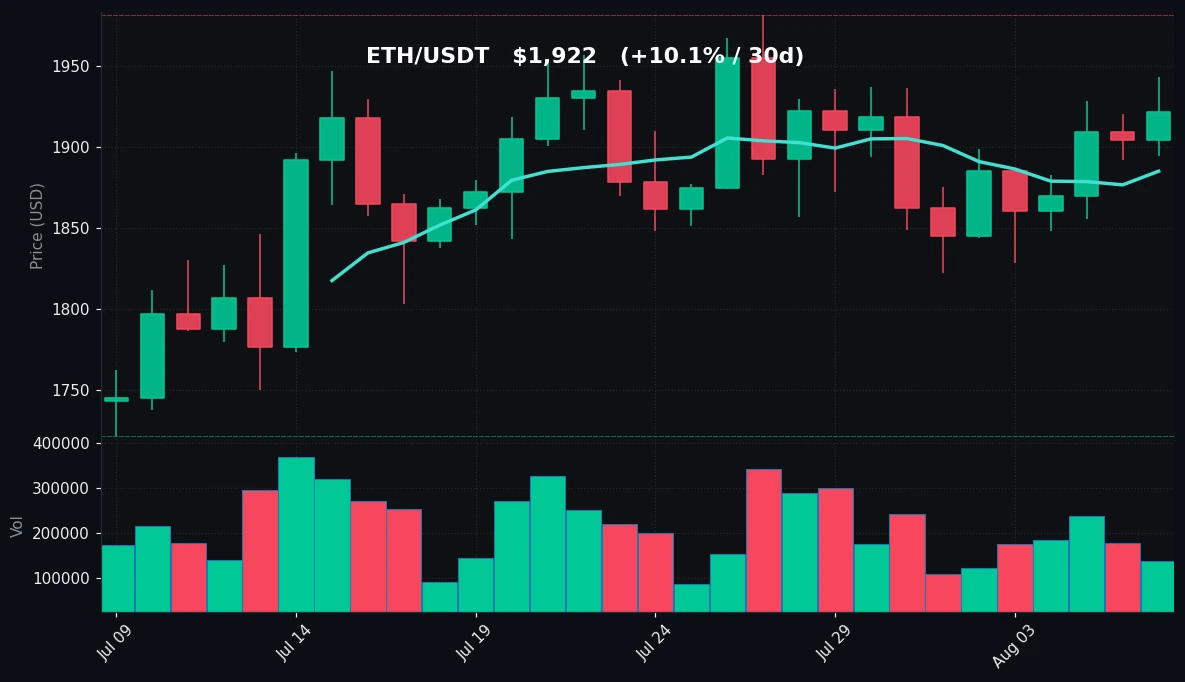
TradingView Live (4h)
Ethereum is trading at $1,922, up 0.92% over the past 24 hours, within a daily range of $1,894 to $1,943. The asset’s 7-day performance shows a gain of 3.17%, while its 30-day return stands at a more substantial 10.11% — the strongest among the two assets. ETH’s 30-day high of $1,981 was set approximately two weeks ago, and the current price sits about 3% below that level. The 30-day low of $1,722 marks a significant downside reference from late July.
Technically, ETH is trading above both its MA7 ($1,885) and MA30 ($1,873). The spread between these averages is narrow at just $12, indicating that the medium-term trend has been relatively flat, with recent strength pushing price above both. The fact that ETH has held above the MA30 for the past six sessions suggests that the current uptrend has more durability than what was seen in early July, when price repeatedly dipped below this level.
The RSI(14) for ETH is 57.3, slightly higher than BTC’s reading but still firmly in neutral territory. This suggests that ETH has slightly more bullish momentum than BTC, though neither asset is close to overbought conditions. The RSI has been trending upward from the low 40s seen in late July, reflecting the gradual improvement in market sentiment.
Volume for ETH is at 0.78x its 7-day average, which is higher than BTC’s relative volume but still below the baseline. This indicates that ETH’s recent gains have been accompanied by somewhat better participation than BTC, though the overall market remains quiet. The lack of volume expansion during the ETH rally from $1,822 (7-day low) to the current $1,922 is notable — a move of $100 (5.5%) on below-average volume suggests that the rally is being driven by spot buying rather than leveraged speculation.
Key technical levels for ETH are as follows: immediate support at $1,885 (MA7) and $1,873 (MA30), with stronger support at $1,822 (7-day low). On the upside, resistance is at $1,943 (24-hour high), followed by $1,981 (30-day high). The proximity of the current price to the $1,943–$1,981 resistance zone, combined with neutral RSI and moderate volume, suggests that ETH may face a test of this area in the coming sessions. A decisive move above $1,981 would represent a breakout to a new 30-day high, while a failure to hold $1,873 could shift the short-term bias to neutral.
Key Technical Levels
| Asset | Support | Resistance | RSI |
|---|---|---|---|
| BTC | $64,000 (MA7) / $62,275 (7d low) | $65,391 (24h high) / $66,956 (30d high) | 54.8 — neutral |
| ETH | $1,885 (MA7) / $1,873 (MA30) | $1,943 (24h high) / $1,981 (30d high) | 57.3 — neutral |
BTC vs ETH Dynamic
The correlation between BTC and ETH remains high, with both assets moving in near-lockstep over the past 24 hours and 7-day periods. BTC’s 24-hour gain of 1.04% closely mirrors ETH’s 0.92%, and both assets have traded within similar relative ranges — BTC’s daily range is 1.9% of its price, while ETH’s is 2.5%. The key differentiator is the 30-day performance: ETH has outperformed BTC by 7.33 percentage points (10.11% vs 2.78%). This divergence suggests that while the two assets share a common macro driver, ETH is attracting incremental capital flows that BTC is not currently seeing. This could be related to sector-specific developments within the Ethereum ecosystem or a gradual rotation from BTC into higher-beta assets during a period of low volatility. The RSI differential (57.3 vs 54.8) further confirms that ETH has slightly stronger internal momentum. However, the volume profile — with ETH at 0.78x average vs BTC at 0.61x — indicates that ETH’s outperformance is occurring on relatively better participation. Traders monitoring the pair should watch whether ETH can maintain this relative strength if BTC attempts to break above $65,400, as a BTC-led rally often compresses the ETH/BTC ratio.
Strategy Fit
The current market conditions — characterized by low volume (0.61x–0.78x of average), neutral RSI (54–57), and prices hovering near moving averages — suggest a range-bound environment rather than a trending one. BTC is trading in a $62,275–$65,391 band, while ETH is in a $1,822–$1,943 range. This type of market is typically suited for grid trading strategies, which profit from price oscillations within a defined range. The narrow distance between support and resistance (BTC: ~4.8%, ETH: ~6.2%) provides sufficient amplitude for grid bots to capture small, repeated profits. The low volume environment, while limiting the size of moves, also reduces the risk of violent breakouts that could invalidate grid positions.
For traders with a longer time horizon, a DCA (dollar-cost averaging) approach remains viable given that both assets are above their 30-day moving averages and the broader trend is upward. The fact that BTC and ETH have both held above their MA30 for multiple sessions suggests that accumulation at current levels is not fighting the primary trend.
Trend-following strategies are less optimal in this environment, as the low volume and neutral RSI indicate that neither asset has the momentum to establish a decisive directional move. Pionex offers built-in grid bots (both neutral and leveraged) that are well-suited for the current range-bound conditions, as well as DCA bots that can automate periodic purchases. For more active traders, Pionex’s spot grid bot can be configured with upper and lower limits aligned to the key technical levels outlined above. Given the current volatility regime (BTC’s daily range is under 2%), a grid with 0.3–0.5% spacing would generate frequent fills without excessive risk of a range breakout.
Risk Disclaimer
This market recap is provided for informational and educational purposes only and does not constitute financial advice, investment advice, trading advice, or any other form of professional advice. Cryptocurrency markets are highly volatile and involve substantial risk of loss. Past performance is not indicative of future results. The technical analysis, levels, and observations presented in this document are based on historical data and current market conditions, which may change rapidly without notice. You should not make any investment decisions based solely on this content. Always conduct your own research, consider your financial situation and risk tolerance, and consult with a qualified financial advisor before engaging in any cryptocurrency trading or investment activity. Neither the author nor any affiliated entity shall be held liable for any losses or damages arising from the use of this information. Trading cryptocurrencies may be restricted or prohibited in your jurisdiction; it is your responsibility to ensure compliance with applicable laws and regulations.
FAQ
Q1: Why is ETH outperforming BTC on the 30-day timeframe?
ETH has gained 10.11% over the past 30 days compared to BTC’s 2.78%. This divergence is likely due to sector-specific capital rotation into Ethereum, potentially driven by ecosystem developments, while BTC is consolidating after its earlier moves. The RSI differential (57.3 vs 54.8) confirms ETH has slightly stronger momentum.
Q2: What does the low volume (0.61x–0.78x of average) indicate?
Low volume during a price increase suggests that the rally is not fully supported by broad market participation. This can mean the move is driven by a smaller group of buyers and may be less sustainable. However, it can also precede a volume expansion that confirms the trend.
Q3: Are BTC and ETH overbought or oversold?
Neither asset is overbought or oversold. BTC’s RSI(14) is 54.8 and ETH’s is 57.3, both in neutral territory (typically defined as 30–70). This indicates that there is room for movement in either direction without immediate technical resistance from RSI.
Q4: What are the most important support levels to watch?
For BTC, the critical support is $64,000 (MA7) with a secondary level at $62,275 (7-day low). For ETH, watch $1,885 (MA7) and $1,873 (MA30). A daily close below these levels would signal a short-term bearish shift.
Q5: How does the current market environment affect grid trading strategies?
The current low-volatility, range-bound conditions are generally favorable for grid trading. BTC is range-bound between $62,275 and $65,391, and ETH between $1,822 and $1,943. Grid bots profit from repeated price oscillations within these ranges, and the current volume profile reduces the risk of sudden breakouts that could cause grid losses.


