BTC ETH Daily Recap — 2026-08-06

BTC ETH Daily Recap — 2026-08-06
Today at a Glance
The crypto market on August 6, 2026, showed a quiet consolidation phase, with both Bitcoin and Ethereum trading in narrow ranges. Bitcoin slipped 0.38% over the past 24 hours, settling at $64,422 after testing an intraday high of $64,999 and a low of $64,172. The asset remains above its 7-day moving average of $63,714 but slightly below its 30-day average of $64,203, indicating a neutral-to-cautious posture. Ethereum demonstrated relative resilience, down just 0.14% to $1,906, with a 24-hour range of $1,892–$1,921. Notably, ETH’s 30-day performance outpaces BTC, gaining 9.33% versus BTC’s 3.42%. Volume contraction is evident across both assets—BTC trading at 0.43x its 7-day average and ETH at 0.57x—suggesting reduced participation and potential wait-and-see behavior among traders. RSI readings (BTC: 46.3, ETH: 53.4) confirm a lack of directional momentum, positioning the market for a potential breakout once volume returns.
Bitcoin Analysis
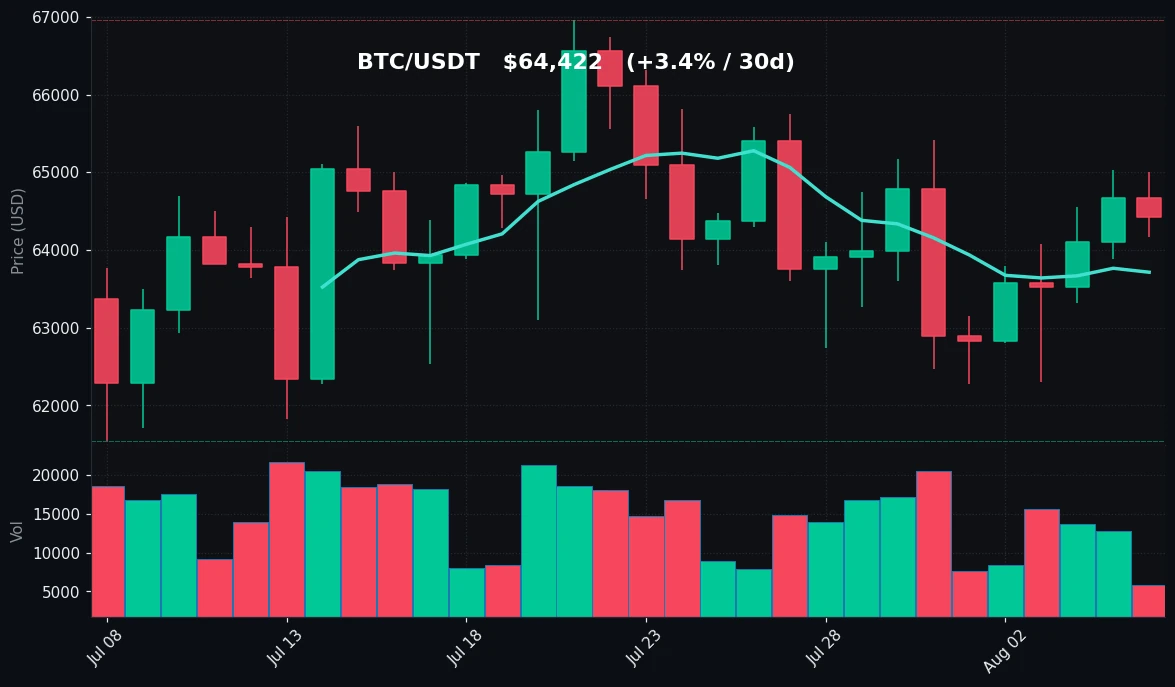
TradingView Live (4h)
Bitcoin’s price action on August 6, 2026, reflects a market in a holding pattern. The current price of $64,422 sits within a well-defined short-term range established over the past week, bounded by a 7-day high of $65,410 and a low of $62,275. The 30-day range is wider, with a high of $66,956 and a low of $61,545, providing a broader context of the asset’s recent volatility. Notably, BTC has managed to hold above its 7-day moving average (MA7) of $63,714, a positive short-term signal, but remains below the 30-day moving average (MA30) of $64,203. This positioning—above MA7 but below MA30—typically indicates a transitional phase where the market is undecided between short-term bullish momentum and medium-term bearish pressure.
The 24-hour trading range of $64,172 to $64,999 highlights a tight band of just over $800, reflecting diminished volatility. This compression is further underscored by the volume metric: current trading volume is only 0.43 times the 7-day average. Such a significant drop in participation often precedes a decisive move, as liquidity thins and order books become more sensitive to larger trades. From a technical indicator standpoint, the Relative Strength Index (RSI) at 46.3 places BTC in neutral territory, neither oversold nor overbought. This reading suggests that the recent price decline from the 30-day high has not yet generated sufficient selling pressure to mark the asset as oversold, nor has the bounce from the 7-day low created buying momentum.
Examining the recent trajectory, BTC’s 7-day performance of -0.55% is marginal, while the 30-day gain of +3.42% indicates a slow but positive medium-term trend. The price structure shows a series of higher lows since the 30-day low of $61,545, which could be interpreted as accumulation. However, the failure to break above the $65,410 resistance level on multiple attempts suggests that sellers are present at higher prices. The current level of $64,422 places BTC roughly in the middle of its recent ranges, offering no clear technical edge for directional traders. The market appears to be awaiting a catalyst—either a volume surge to push through resistance or a breakdown below the MA7 support to signal a retest of lower levels.
Ethereum Analysis
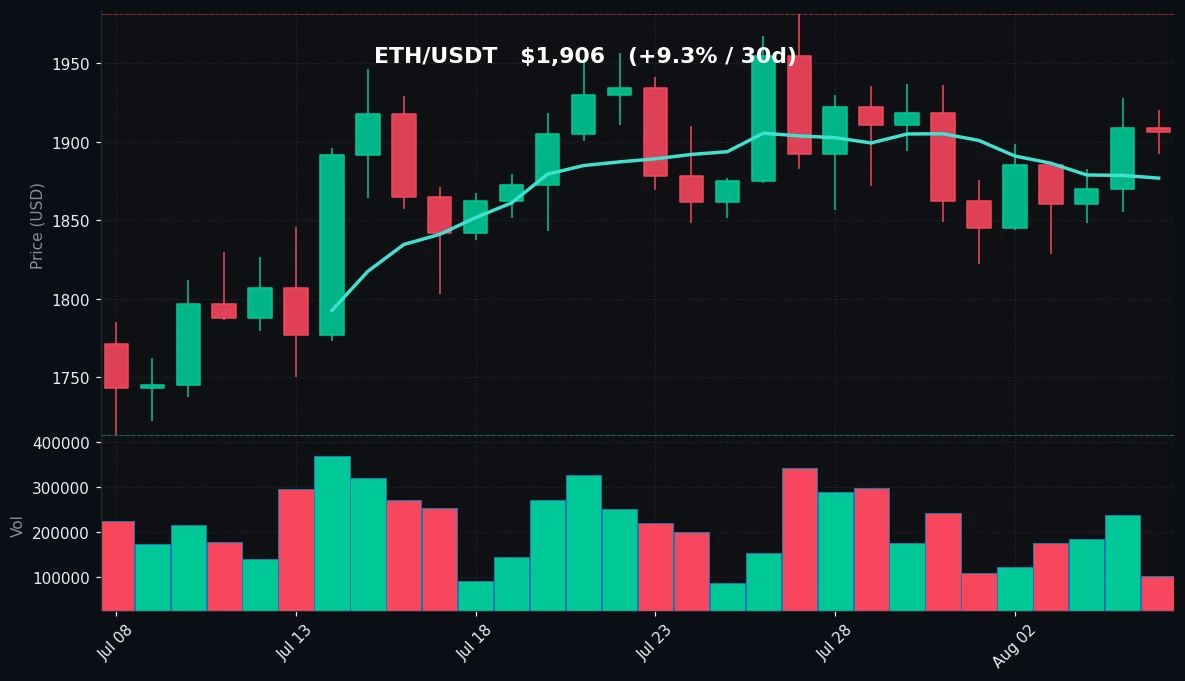
TradingView Live (4h)
Ethereum is exhibiting a slightly more constructive technical picture compared to Bitcoin, though it shares the overarching theme of consolidation. At $1,906, ETH is down a marginal 0.14% over the past 24 hours, with a trading range of $1,892 to $1,921. This narrow band of $29 underscores the low-volatility environment currently gripping the market. The asset’s 7-day performance is slightly negative at -0.63%, but its 30-day gain of +9.33% is notably stronger than BTC’s, indicating that ETH has been a relative outperformer over the past month.
From a moving average perspective, ETH is trading above both its MA7 of $1,877 and its MA30 of $1,868. This is a bullish alignment in the short and medium term, suggesting that the underlying trend for ETH is more favorable than for BTC. The price has held above these averages throughout the recent pullback, demonstrating underlying support. The 7-day range of $1,822 to $1,936 shows that ETH recently tested lower levels but successfully bounced back, closing the week near the upper half of that range. The 30-day range of $1,713 to $1,981 provides additional context, with the current price positioned nearer to the top, indicating that ETH is closer to its recent highs than to its lows.
The RSI for ETH stands at 53.4, which is in neutral ground but slightly higher than BTC’s reading. This suggests that ETH has slightly more bullish momentum embedded in its price action. Volume, however, tells a similar story to BTC: current volume is only 0.57 times the 7-day average, indicating a significant drop in trading activity. This volume contraction during a period of price stability often signals that the market is building a base for the next move.
The key level to monitor on the upside is the 30-day high of $1,981, which has acted as a ceiling for the past month. On the downside, the MA7 at $1,877 serves as immediate support, followed by the stronger support zone around $1,822 (the 7-day low). ETH’s ability to maintain its position above its moving averages while BTC struggles below its MA30 suggests a potential rotation toward ETH in the medium term. However, the lack of volume makes it difficult to confirm any sustained directional move. The market structure for ETH appears to be a slow grind higher, punctuated by periods of low volatility and reduced participation.
Key Technical Levels
| Asset | Support | Resistance | RSI |
|---|---|---|---|
| BTC | $63,714 (MA7) | $65,410 (7d high) | neutral (46.3) |
| ETH | $1,877 (MA7) | $1,936 (7d high) | neutral (53.4) |
Additional levels to consider: For BTC, the $62,275 (7d low) serves as a secondary support, while the $66,956 (30d high) is a major resistance. For ETH, $1,822 (7d low) is a secondary support, with $1,981 (30d high) as a key resistance. Both assets are in neutral RSI territory, indicating no extreme overbought or oversold conditions.
BTC vs ETH Dynamic
The correlation between Bitcoin and Ethereum remains high, as is typical in the crypto market, but subtle divergences are emerging. Both assets are trading in narrow ranges with reduced volume, yet ETH’s relative strength is notable. Over the past 30 days, ETH has outperformed BTC by nearly 6 percentage points (9.33% vs. 3.42%). This divergence is also visible in the moving average structure: ETH trades above both its MA7 and MA30, while BTC is below its MA30. Such a configuration often suggests that capital is rotating from BTC into ETH, or that ETH is attracting incremental demand due to its lower valuation relative to its recent performance. The RSI differential (53.4 vs. 46.3) further confirms that ETH carries slightly more bullish momentum. However, the high correlation means that a significant move in BTC will likely drag ETH in the same direction, regardless of the current relative strength. Traders should watch for a potential decoupling event if the volume returns and ETH manages to break its 30-day high while BTC remains range-bound.
Strategy Fit
Given the current market conditions—extremely low volatility, reduced volume, and neutral RSI readings—the most suitable trading approach is a range-bound or mean-reversion strategy. Both BTC and ETH are trading within well-defined ranges, with clear support and resistance levels. A grid trading bot, such as those available on Pionex, would be well-suited to this environment. Grid bots automatically place buy and sell orders at predetermined intervals, profiting from the oscillation of prices within a range. With BTC’s 24-hour range of $827 and ETH’s range of $29, a grid bot can capture these small price movements repeatedly without requiring a directional bias.
For traders with a longer time horizon, a DCA (Dollar-Cost Averaging) strategy could also be appropriate. The fact that BTC is below its MA30 and ETH is above its moving averages suggests that the market is in a consolidation phase. DCA allows investors to accumulate positions over time, smoothing out the entry price and reducing the risk of mistiming the market. This is particularly relevant when volume is low, as price movements can be unpredictable and subject to sudden spikes. Trend-following strategies, on the other hand, are less effective in this environment, as the lack of volume and narrow ranges do not provide sufficient momentum for such approaches to generate meaningful returns. Pionex’s built-in grid bots and DCA bots offer automated solutions that can operate 24/7, taking advantage of the current market structure without requiring constant manual oversight.
Risk Disclaimer
This market recap is provided for informational and educational purposes only and does not constitute financial advice, investment advice, or a recommendation to buy, sell, or hold any cryptocurrency or digital asset. The data and analysis presented herein are based on historical and current market conditions, which are subject to change without notice. Cryptocurrency markets are highly volatile and involve substantial risk, including the potential loss of the entire invested capital. Past performance is not indicative of future results. Any trading strategies mentioned, including grid trading, DCA, or trend following, carry inherent risks and may not be suitable for all investors. You should conduct your own research and consult with a qualified financial advisor before making any investment decisions. The author and publisher of this report assume no liability for any financial losses or damages arising from the use of this information.
FAQ
Q1: Why is Bitcoin trading below its 30-day moving average while Ethereum is above it?
A1: This divergence reflects different momentum profiles. BTC’s 30-day MA of $64,203 is slightly above its current price of $64,422, indicating that the recent price action has been weaker relative to the past month. ETH’s price of $1,906 is above both its MA7 ($1,877) and MA30 ($1,868), showing that its recent performance has been stronger. This could be due to sector-specific factors, such as increased activity in Ethereum-based applications or a general rotation of capital from BTC to ETH.
Q2: What does the low trading volume (0.43x for BTC and 0.57x for ETH) indicate?
A2: Low volume relative to the 7-day average indicates reduced market participation. This often occurs during consolidation phases when traders are uncertain about the next directional move. Low volume can lead to exaggerated price movements on relatively small orders, but it also suggests that the current price levels are not being aggressively contested by either buyers or sellers. It is a neutral signal that often precedes a period of higher volatility.
Q3: Are the RSI levels of 46.3 (BTC) and 53.4 (ETH) significant?
A3: Both RSI values are in neutral territory (typically defined as 30–70). An RSI of 46.3 for BTC suggests slightly bearish momentum but not oversold conditions. An RSI of 53.4 for ETH indicates slightly bullish momentum but not overbought. These readings are consistent with a market that is trending sideways, with no extreme buying or selling pressure. They do not provide a strong signal for entry or exit on their own.
Q4: What are the key support and resistance levels to watch for BTC and ETH?
A4: For BTC, immediate support is at $63,714 (MA7), with stronger support at $62,275 (7d low). Resistance is at $65,410 (7d high), followed by $66,956 (30d high). For ETH, support is at $1,877 (MA7), with secondary support at $1,822 (7d low). Resistance is at $1,936 (7d high), followed by $1,981 (30d high). A break above or below these levels could signal the next directional move.
Q5: How should traders approach the market given the current low volatility?
A5: In low-volatility environments, range-bound strategies such as grid trading tend to perform well, as they profit from price oscillations within a defined range. DCA strategies are also suitable for long-term accumulation. Trend-following strategies are less effective due to the lack of sustained directional movement. Traders should also be prepared for a potential volatility expansion, as low volatility periods are often followed by significant price moves. Utilizing automated tools like Pionex’s grid and DCA bots can help execute these strategies consistently.


