BTC ETH Daily Recap — 2026-08-09

BTC ETH Daily Recap — 2026-08-09
Today at a Glance
Bitcoin and Ethereum both posted modest gains on August 9, 2026, with BTC rising 0.39% to $65,216 and ETH climbing 0.38% to $1,924. The intraday ranges were tight—BTC oscillated between $64,730 and $65,266, while ETH traded within a narrow $14 band ($1,912–$1,926). Weekly performance remains positive for both assets: BTC is up 2.59% over the last seven days, while ETH has gained 2.05% in the same period. Notably, ETH's 30-day return of +7.62% outpaces BTC's +2.19%, suggesting relative strength in the altcoin. Volume is significantly subdued, with both assets trading at roughly one-quarter to one-third of their 7-day average volume, indicating low participation and a cautious market posture. RSI readings (BTC 48.8, ETH 45.2) sit in neutral territory, leaving room for directional moves without immediate overbought or oversold conditions.
Bitcoin Analysis
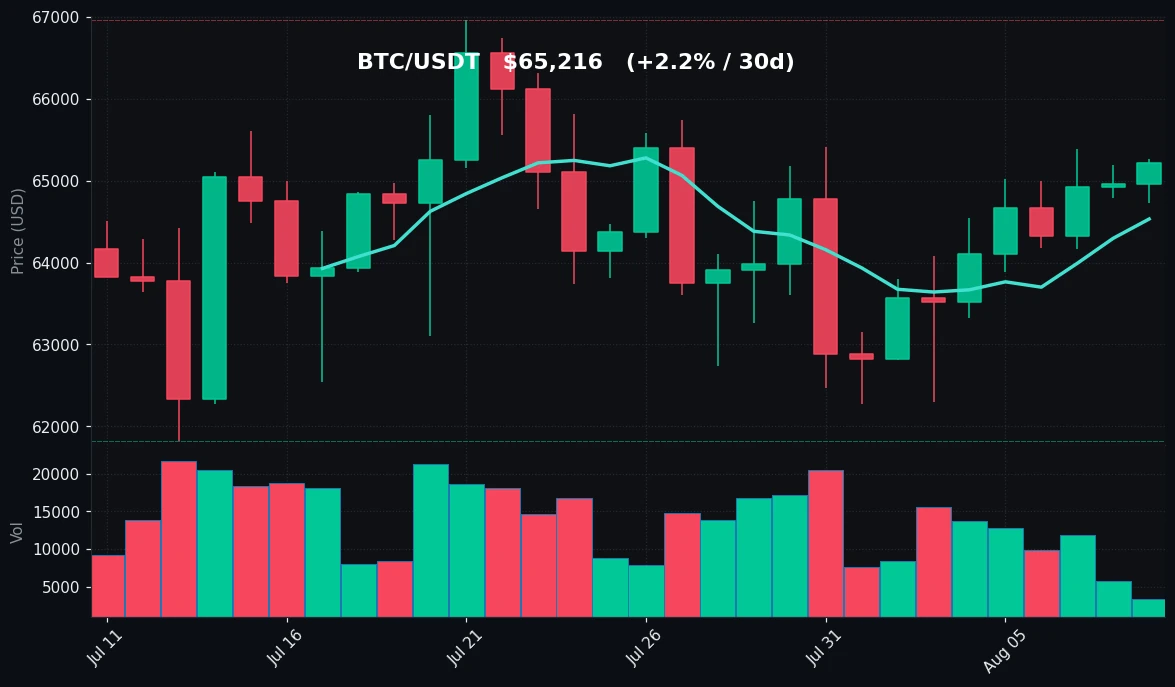
TradingView Live (4h)
Bitcoin is consolidating just below its 7-day high of $65,391, which was set earlier in the week. The current price of $65,216 places BTC above both its 7-day moving average ($64,531) and 30-day moving average ($64,381). The bullish alignment of these short-term MAs—with MA7 above MA30—suggests a mild upward tilt in the prevailing trend, although the spread between them is narrow (only $150), reflecting a market that has been range-bound rather than trending strongly.
The 30-day trading band spans from a low of $61,825 to a high of $66,956. BTC currently sits closer to the upper end of this range, having recovered roughly 71% of the distance from the monthly low to the monthly high. The 7-day range ($62,300–$65,391) shows that buyers have stepped in at progressively higher lows over the past week, a constructive sign for momentum, though the failure to break beyond $65,400 twice suggests overhead supply.
Volume is the most notable technical signal today. At 0.3x the 7-day average, participation is extremely thin. This low-volume environment means that the price action we are seeing—both the upward drift and the resistance at $65,300–$65,400—should be interpreted with caution. Moves on low volume are frequently unreliable and can reverse quickly when larger participants enter the market.
RSI(14) at 48.8 is essentially neutral, sitting just below the 50 midpoint. This implies that neither bulls nor bears have established momentum control. Historically, when BTC's RSI is in this zone and volume is contracting, the market tends to remain in a holding pattern until a catalyst emerges. The key technical levels to watch are the 7-day high at $65,391 as immediate resistance, and the MA7 at $64,531 as first support. A sustained break above $65,400 on rising volume would signal renewed buying interest, while a loss of the MA7 could open a path toward the $62,300–$63,000 support zone.
Ethereum Analysis
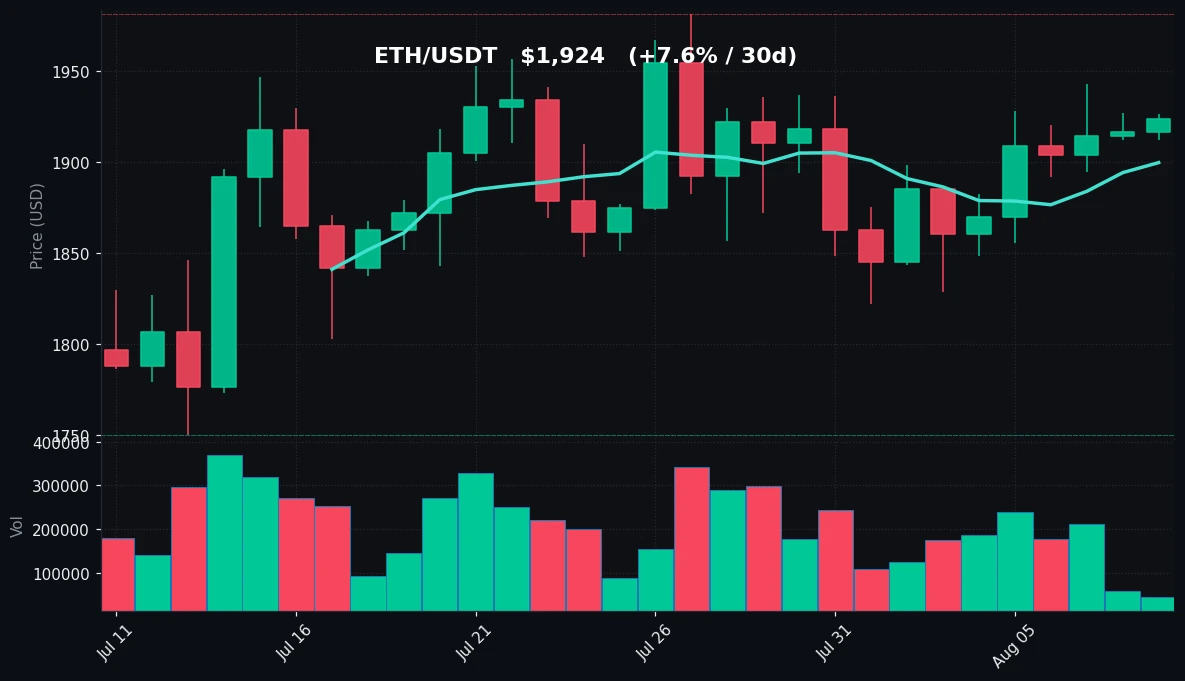
TradingView Live (4h)
Ethereum is trading at $1,924, having gained 0.38% over the past 24 hours. The asset remains within its 7-day range of $1,829–$1,943, currently positioned in the upper third of that band. Across the 30-day window, ETH has moved between $1,750 and $1,981, meaning the current price represents a recovery of approximately 70% from the monthly low—similar to Bitcoin's position within its own range.
The moving average structure for ETH mirrors BTC's, with MA7 ($1,900) sitting above MA30 ($1,883). However, ETH's 30-day performance (+7.62%) is markedly stronger than BTC's (+2.19%), indicating that ETH has been accumulating relative strength over the past month. The gap between the two moving averages is only $17, which is tight, but the fact that price ($1,924) trades $24 above MA7 suggests short-term bullish momentum is intact, if modest.
Volume for ETH is even thinner than BTC's, at just 0.26x the 7-day average. This is a critical observation—ETH's price recovery from the $1,750 monthly low to the current $1,924 level has occurred on declining participation. The RSI(14) at 45.2 is below the 50 neutral mark, which is interesting given the positive price action. This divergence between price and RSI (price rising while RSI stays subdued) can occur in low-volume markets where price moves are driven by a limited number of trades rather than broad-based buying.
Resistance is clearly defined at the 7-day high of $1,943, with the 30-day high of $1,981 serving as a secondary ceiling. On the downside, the MA7 at $1,900 provides the nearest support, followed by the psychological $1,850–$1,860 zone that acted as support earlier in the week. The thin volume profile means that ETH could experience outsized moves in either direction if volume returns suddenly. The neutral RSI and tight consolidation pattern suggest that ETH is building a base, but confirmation of any breakout will require a significant increase in trading activity.
Key Technical Levels
| Asset | Support | Resistance | RSI |
|---|---|---|---|
| BTC | $64,531 (MA7) / $62,300 | $65,391 / $66,956 | Neutral (48.8) |
| ETH | $1,900 (MA7) / $1,829 | $1,943 / $1,981 | Neutral (45.2) |
BTC vs ETH Dynamic
Bitcoin and Ethereum are exhibiting a high degree of correlation today, with both assets posting nearly identical 24-hour percentage changes (+0.39% vs +0.38%) and trading within similarly narrow ranges relative to their recent volatility. The 30-day performance gap—ETH at +7.62% versus BTC at +2.19%—is notable and suggests that capital has been rotating toward ETH in recent weeks, possibly driven by sector-specific catalysts such as network upgrades or DeFi activity. However, the current low-volume environment is compressing the correlation coefficient toward 1, as neither asset is generating independent directional momentum. If volume returns, the divergence in 30-day performance could reassert itself, with ETH potentially leading on the upside given its stronger relative positioning. Conversely, in a risk-off scenario, BTC's larger market cap and deeper liquidity typically make it more resilient, while ETH may experience amplified downside moves. Traders should monitor the BTC/ETH ratio, which has been declining over the past month, as a reversal in this ratio would signal a shift in relative strength.
Strategy Fit
The prevailing market conditions—low volatility, thin volume, and neutral RSI readings on both BTC and ETH—are not conducive to trend-following or breakout strategies. The tight trading ranges and absence of directional momentum argue against aggressive directional positioning. Instead, range-bound strategies are better suited to the current environment.
Grid trading is the most appropriate approach for today's conditions. With BTC oscillating between $64,730 and $65,266 intraday, and ETH between $1,912 and $1,926, a grid bot can systematically buy at support levels and sell at resistance levels, capturing small profits from each oscillation. The narrow ranges mean that grid spacing should be tight (e.g., 0.2–0.3% per grid level for BTC) to ensure sufficient trade frequency. Pionex's built-in grid bots are well-suited for this, as they can be configured to automatically place buy and sell orders within a defined price range, requiring no active management.
DCA (Dollar-Cost Averaging) is also a viable strategy, particularly given the neutral RSI and the fact that both assets are trading above their 30-day moving averages. A systematic DCA approach would accumulate positions at regular intervals, smoothing out the current low-volatility noise. Pionex offers DCA bots that automate this process, executing buy orders at set intervals or price thresholds.
Trend-following strategies are not recommended today. The volume is too thin to confirm any breakout, and the RSI readings suggest that neither asset has established momentum. Attempting to trade a trend in this environment risks entering on false signals. If a trader prefers trend strategies, waiting for a volume expansion above the 7-day average and a confirmed break of the key resistance levels ($65,391 for BTC, $1,943 for ETH) would be a more prudent entry point.
Risk Disclaimer
This market recap is provided for informational and educational purposes only. It does not constitute financial advice, investment advice, trading advice, or any other type of professional advice. Cryptocurrency markets are highly volatile and involve substantial risk of loss. Past performance is not indicative of future results. The technical analysis, levels, and observations presented herein are based on historical data and current market conditions, which can change rapidly without notice. You should not make any investment decisions based solely on this document. Always conduct your own research, understand the risks involved, and consult with a qualified financial advisor before making any investment or trading decisions. Neither the author nor any affiliated entity shall be liable for any loss or damage arising from reliance on the information provided.
FAQ
Q1: Why is Bitcoin's volume so low today compared to its 7-day average?
The current volume is only 0.3x the 7-day average, indicating that market participation has dropped significantly. This can occur during periods of low volatility, when traders are waiting for a catalyst, or during certain calendar periods (e.g., weekends or holidays). Low volume often precedes a period of increased volatility, as the market may be building energy for a larger move.
Q2: What does a neutral RSI reading (48.8 for BTC, 45.2 for ETH) imply?
An RSI near 50 suggests that buying and selling pressure are roughly balanced. Neither the bulls nor the bears have established control. In such conditions, the price tends to consolidate until a new catalyst shifts the balance. It also means that the asset is neither overbought (which would suggest a pullback) nor oversold (which would suggest a bounce).
Q3: Is Ethereum's stronger 30-day performance (+7.62%) a sign of a trend shift from BTC to ETH?
It could indicate a relative strength shift, but a single month of data is not conclusive. ETH may be benefiting from specific catalysts, such as network upgrades, increased DeFi activity, or a rotation of capital from BTC into ETH. Traders should monitor the BTC/ETH ratio over a longer period to determine if this is a sustainable trend or a temporary rebalancing.
Q4: What are the most important price levels to watch for Bitcoin right now?
The immediate resistance is at $65,391 (the 7-day high), with a secondary level at $66,956 (the 30-day high). On the downside, the first support is the 7-day moving average at $64,531, followed by the $62,300 level. A break above $65,391 could signal a retest of the monthly high, while a break below $64,531 might open the path toward $62,300.
Q5: How can I use a Pionex grid bot in the current market conditions?
Given the tight trading ranges, you can set up a grid bot with narrow spacing (e.g., 0.2–0.5%) between the current support and resistance levels. For BTC, you might set a grid between $64,500 and $65,400. For ETH, between $1,890 and $1,950. The bot will automatically place buy orders at the lower end and sell orders at the upper end, capturing profits from each oscillation. Ensure you monitor the bot and adjust the range if the price breaks out of the defined boundaries.


