BTC ETH Daily Recap — 2026-08-08

BTC ETH Daily Recap — 2026-08-08
Today at a Glance
The crypto market opened the trading session on August 8, 2026, with a quiet yet constructive tone. Bitcoin (BTC) traded at $65,015, up 0.14% over the past 24 hours, while Ethereum (ETH) gained 0.33% to reach $1,920. Both assets continue to hold above their respective 7-day and 30-day moving averages, signaling sustained mid-term momentum despite a notable drop in trading volume. BTC’s intraday range was narrow—between $64,784 and $65,074—indicating a consolidation phase after last week’s push toward $65,391. ETH mirrored this behavior, oscillating between $1,912 and $1,924. The 7-day performance remains positive: BTC +3.49%, ETH +4.09%. However, trading volumes have contracted sharply to 0.29x and 0.17x of their weekly averages, suggesting that the current price action is driven more by positioning than fresh capital inflows. RSI readings (BTC 53.7, ETH 55.7) remain in neutral territory, leaving room for directional movement without immediate overbought or oversold pressure.
Bitcoin Analysis
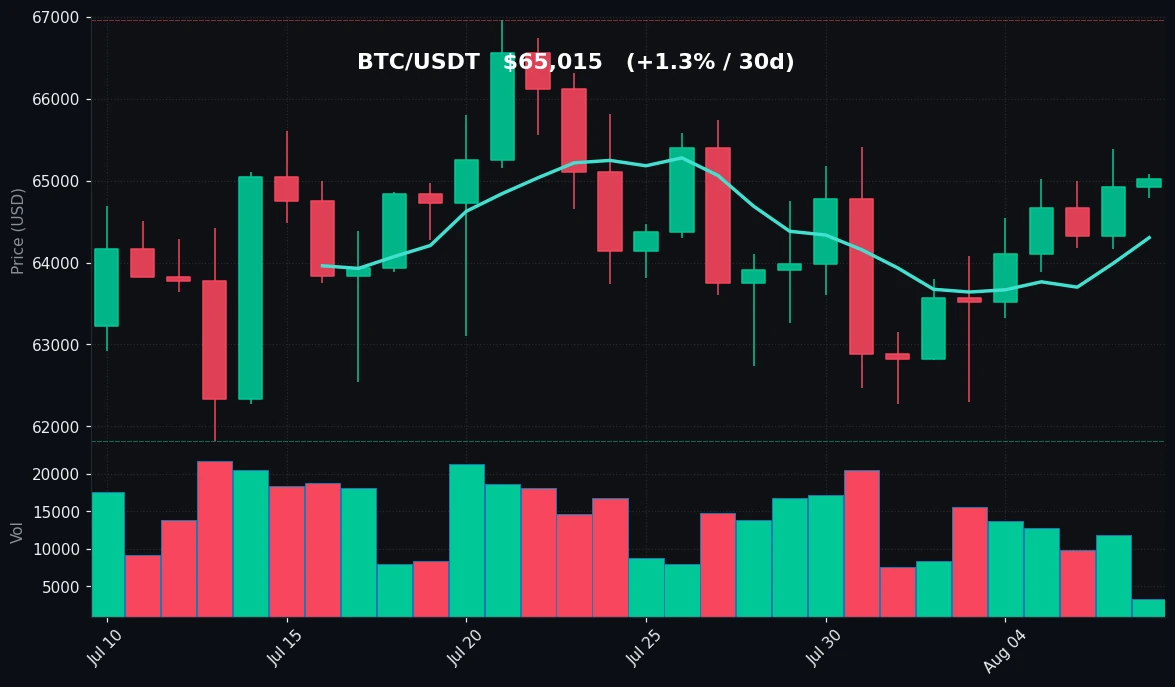
TradingView Live (4h)
Bitcoin’s price action on August 8 reflects a market in a holding pattern. After a strong weekly performance that pushed BTC from a 7-day low of $62,300 to a high of $65,391, the asset now sits just below that peak, trading at $65,015. The 24-hour range of $64,784–$65,074 is remarkably tight, with a spread of only $290, indicating that neither buyers nor sellers are willing to commit aggressively at current levels.
From a technical perspective, BTC remains above both its 7-day moving average (MA7: $64,303) and its 30-day moving average (MA30: $64,347). The fact that the MA7 has crossed above the MA30 is a bullish alignment, though the margin is slim ($44). This suggests that the short-term trend has slightly overtaken the medium-term baseline, but the lack of separation implies fragility—any significant downside move could quickly erase this advantage.
The RSI(14) sits at 53.7, which is comfortably within neutral territory (typically 45–55 is considered balanced). This reading indicates that the recent rally from $62,300 to $65,391 has not yet exhausted buying pressure, but also that the asset is not overbought. There is no sign of momentum divergence or exhaustion at this stage.
Volume is the most notable concern. The current volume is only 0.29x the 7-day average, meaning that today’s trading activity is roughly 71% below the norm. This is a significant contraction, and it raises questions about the sustainability of the current price level. Low-volume environments often lead to sharp, unpredictable moves once liquidity returns. The 30-day range—between $61,825 and $66,956—provides a broader context: BTC is currently in the upper-middle portion of this range, having recovered from the late-July dip but still below the 30-day high.
In summary, Bitcoin’s technical posture is neutral-to-slightly-bullish, with price above key moving averages and RSI in a healthy zone. However, the volume contraction is a cautionary signal. The market appears to be waiting for a catalyst—either macro news or a shift in futures positioning—to break the current equilibrium.
Ethereum Analysis
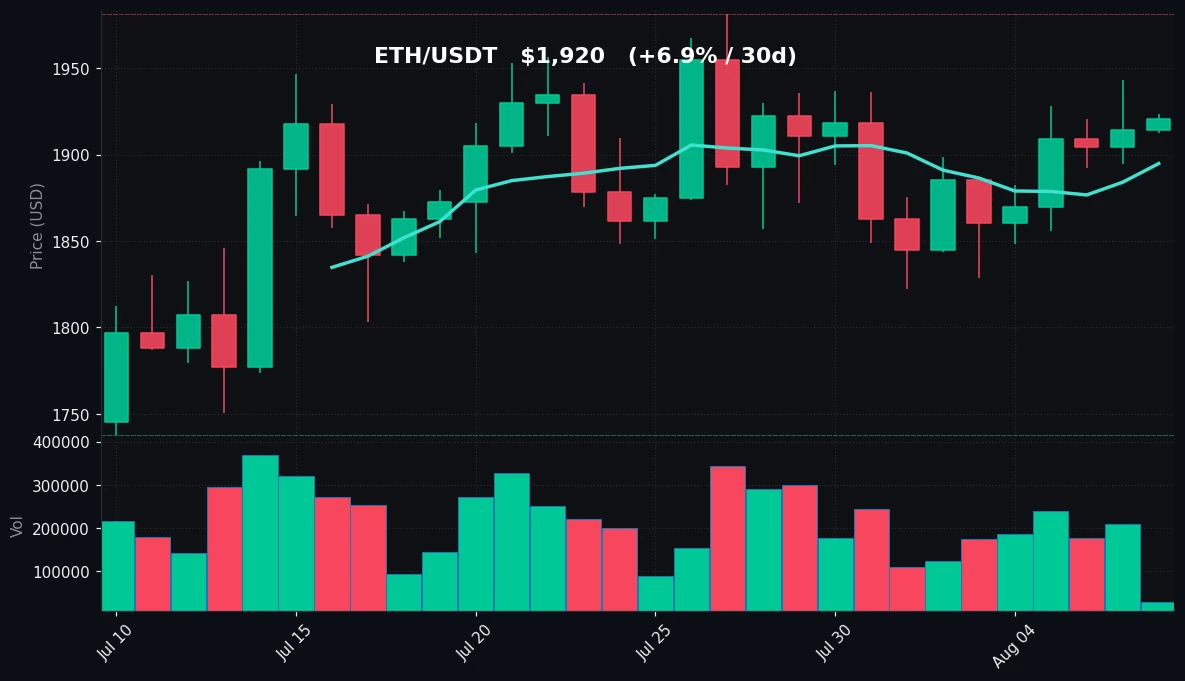
TradingView Live (4h)
Ethereum is exhibiting a slightly stronger relative performance than Bitcoin, with a 24-hour gain of 0.33% and a more pronounced 7-day advance of 4.09%. ETH currently trades at $1,920, having recovered from a 7-day low of $1,829 to a high of $1,943. The 30-day picture is also constructive: ETH is up 6.88% over the past month, with a 30-day range of $1,738 to $1,981.
Technically, ETH is positioned above both its MA7 ($1,895) and MA30 ($1,879). The spread between these two averages is $16, which is slightly wider than BTC’s, indicating a marginally stronger short-term trend. However, the 30-day high of $1,981 remains untested, and ETH would need to gain over 3% from current levels to approach that mark.
The RSI(14) for ETH is 55.7, which is slightly higher than BTC’s reading but still firmly in neutral territory. This suggests that ETH has slightly more momentum behind it, but not enough to classify the asset as overbought. The RSI has room to climb toward 60-65 before any overbought conditions would typically be flagged.
Volume data for ETH is even more striking than BTC’s: current volume is only 0.17x the 7-day average, representing an 83% contraction. This is an extreme level of inactivity. It is worth noting that ETH’s 24-hour range ($1,912–$1,924) is only $12 wide, which is unusually narrow for an asset with ETH’s volatility profile. This compression often precedes a significant expansion in volatility, though the direction of that expansion is not predetermined.
Comparing ETH to its own recent history, the asset has shown resilience since the July lows around $1,738. The recovery has been steady but not explosive, with price grinding higher in a series of small steps. The lack of volume suggests that this is a passive rally—driven by reduced selling pressure rather than aggressive accumulation.
In conclusion, ETH’s technical setup is marginally more bullish than BTC’s, with a higher RSI and a slightly wider MA7/MA30 gap. However, the extreme volume contraction is a double-edged sword: it could mean that the price is stable due to lack of sellers, or that a sudden influx of activity could cause outsized moves in either direction.
Key Technical Levels
| Asset | Support | Resistance | RSI |
|---|---|---|---|
| BTC | $64,303 (MA7) | $65,391 (7d high) | Neutral (53.7) |
| ETH | $1,895 (MA7) | $1,943 (7d high) | Neutral (55.7) |
For BTC, the immediate support is the 7-day moving average at $64,303, followed by the psychological $64,000 level and the 30-day MA at $64,347. On the upside, resistance is at the 7-day high of $65,391, with the 30-day high of $66,956 serving as the next major barrier.
For ETH, support sits at the MA7 of $1,895, with a secondary level at $1,879 (MA30). Resistance is at the 7-day high of $1,943 and then the 30-day high of $1,981. Given the tight trading ranges, these levels are likely to be tested in the coming sessions.
BTC vs ETH Dynamic
The correlation between BTC and ETH remains high, as evidenced by their synchronized price action over the past week. Both assets bottomed around the same time (BTC at $62,300, ETH at $1,829) and rallied in tandem, with ETH outperforming slightly (+4.09% vs +3.49% over 7 days). This suggests that the current market is driven by macro factors affecting the entire crypto sector rather than asset-specific news. However, the volume divergence is noteworthy: ETH’s volume contraction (0.17x) is far more severe than BTC’s (0.29x), which could indicate that ETH’s price is more reliant on thin order books. In relative terms, ETH’s RSI (55.7) is higher than BTC’s (53.7), and ETH’s 30-day gain (+6.88%) outpaces BTC’s (+1.33%). This suggests that ETH has been accumulating a slight relative strength advantage, though it has not yet translated into a decisive breakout. The ETH/BTC ratio, while not explicitly provided, can be inferred to be trending slightly upward based on these performance figures.
Strategy Fit
Given the current market conditions—low volatility, tight ranges, and significantly reduced trading volumes—the most appropriate strategy is one that capitalizes on range-bound behavior rather than directional trends.
Grid trading is particularly well-suited for this environment. With BTC oscillating between $64,784 and $65,074 and ETH between $1,912 and $1,924, a grid bot can systematically place buy and sell orders within these ranges, profiting from the small price oscillations. The low volume actually benefits grid strategies, as they do not require strong directional momentum to generate returns. However, traders should set wider grid spacing to account for the possibility of a volatility expansion.
DCA (Dollar-Cost Averaging) remains a viable approach for longer-term accumulation, especially given that both assets are trading above their 30-day moving averages but below their 30-day highs. A DCA strategy would allow investors to build positions without trying to time the market, which is prudent in a low-volume environment where price discovery is unreliable.
Trend-following strategies are less appropriate today, as neither BTC nor ETH is exhibiting a clear directional breakout. The RSI readings in the low-to-mid 50s do not confirm a strong trend in either direction.
Pionex offers built-in grid trading bots that can be configured to operate within custom price ranges, making them a practical tool for this market phase. Additionally, Pionex’s DCA bots allow for automated periodic purchases, which aligns with the current consolidation environment. For more advanced users, the trailing grid bot can adapt to gradual price shifts, providing flexibility if the current tight ranges begin to expand.
Risk Disclaimer
This market recap is provided for informational and educational purposes only and does not constitute financial advice, investment advice, or a recommendation to buy, sell, or hold any digital asset. Cryptocurrency markets are highly volatile and speculative in nature. Past performance is not indicative of future results. The data presented herein is based on publicly available information and is believed to be accurate as of the date of publication, but no warranty is made regarding its completeness or accuracy. You should conduct your own research and consult with a qualified financial advisor before making any investment decisions. Trading cryptocurrencies involves substantial risk of loss, including the potential loss of your entire principal. Never invest more than you can afford to lose.
FAQ
What is the current RSI for Bitcoin and what does it indicate?
Bitcoin’s RSI(14) is currently at 53.7. This is in neutral territory, meaning the asset is neither overbought nor oversold. In practical terms, this suggests that the recent price movement from $62,300 to $65,015 has been absorbed without creating excessive buying pressure. There is room for the price to move in either direction without triggering technical signals of exhaustion.
Why is trading volume so low today?
Both BTC and ETH are experiencing significantly reduced trading volumes compared to their 7-day averages—BTC at 0.29x and ETH at 0.17x. This could be due to a variety of factors, including a lack of major news catalysts, market participants waiting for clearer directional signals, or broader seasonal patterns. Low volume often precedes periods of increased volatility, as order books become thinner and larger trades have a greater price impact.
How do the 7-day and 30-day moving averages compare for both assets?
For BTC, the MA7 is $64,303 and the MA30 is $64,347, with the short-term average slightly below the medium-term average. For ETH, the MA7 is $1,895 and the MA30 is $1,879, with the short-term average slightly above. This indicates that ETH has a marginally more bullish short-term alignment, while BTC’s moving averages are nearly converged, suggesting a more indecisive market structure.
What are the key resistance levels to watch?
For BTC, the immediate resistance is at $65,391 (the 7-day high), followed by $66,956 (the 30-day high). For ETH, resistance is at $1,943 (the 7-day high) and then $1,981 (the 30-day high). A break above these levels on above-average volume would be a significant technical development.
Is this a good time to start a grid trading bot?
The current environment of low volatility and tight trading ranges is generally favorable for grid trading bots, as they profit from price oscillations within a defined range. However, given the extremely low volume, there is a risk that a sudden volatility expansion could break the grid range. It is advisable to set grid boundaries wider than the current intraday ranges (e.g., $63,500–$66,500 for BTC) to accommodate potential moves.


