BTC ETH Daily Recap | May 30, 2026: Oversold Pressure Persists as Bears Maintain Control
BTC ETH Daily Recap | May 30, 2026: Oversold Pressure Persists as Bears Maintain Control
Today at a Glance
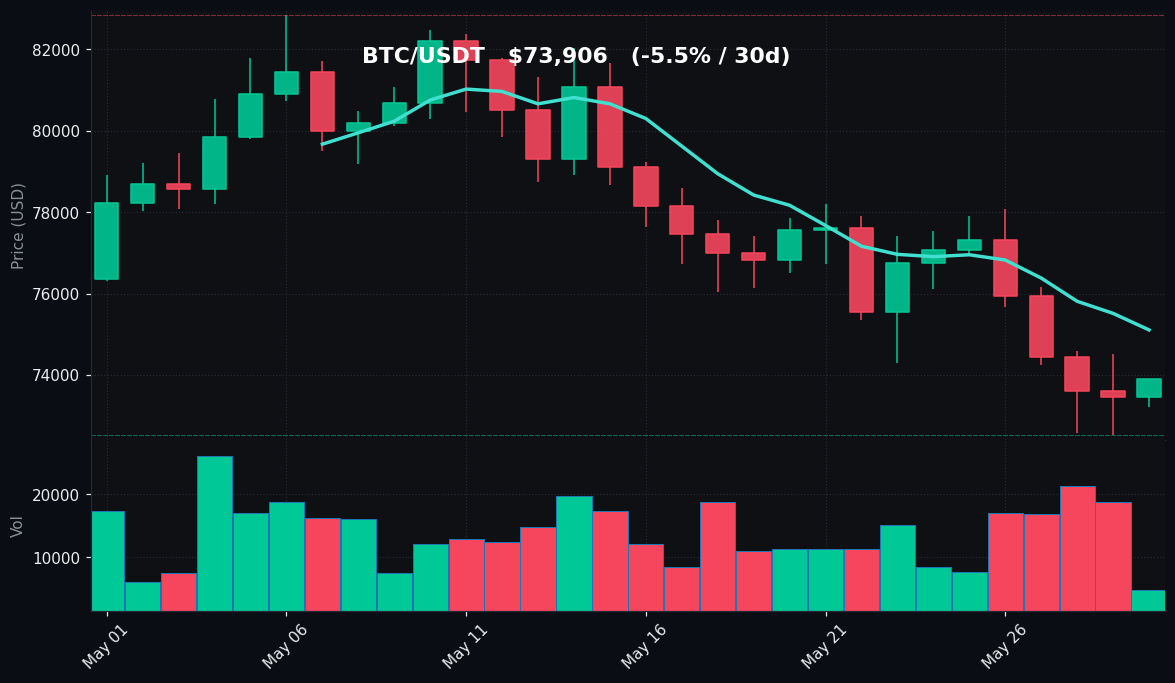
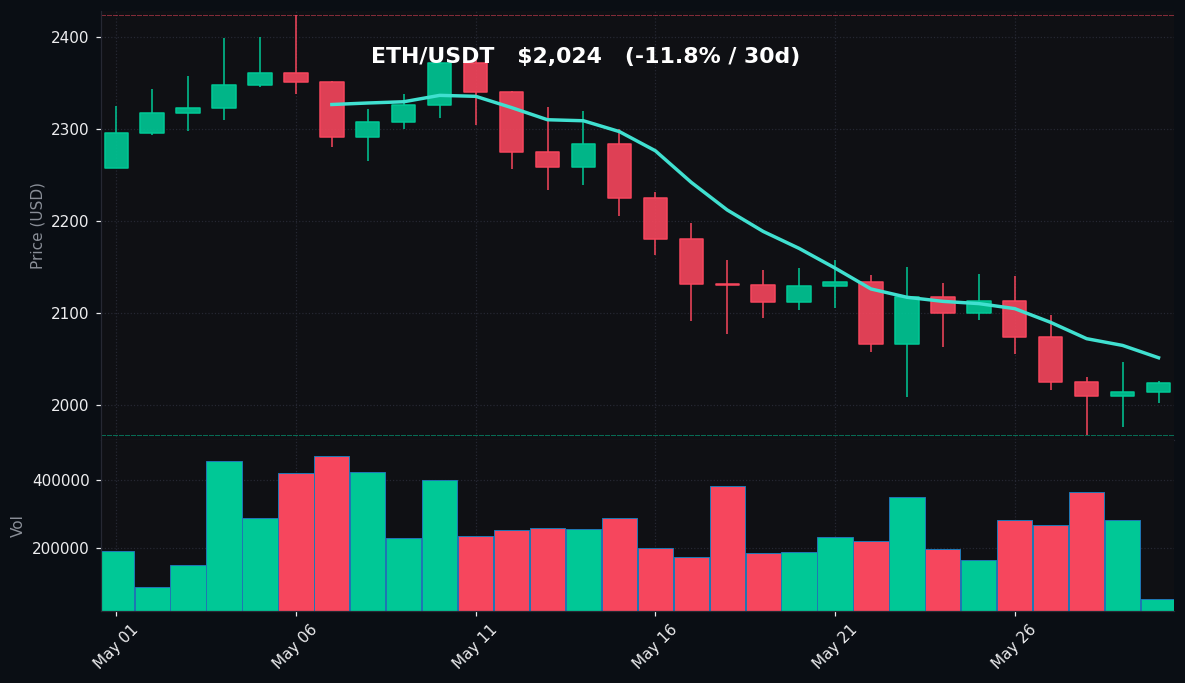
The cryptocurrency market remains under sustained selling pressure on May 30, 2026, with both Bitcoin and Ethereum posting modest daily gains but continuing to trade deep in oversold territory. Bitcoin (BTC/USDT) edged up 0.61% to $73,906, recovering slightly from its intraday low of $73,216, yet remains 5.53% lower over the past 30 days. Ethereum (ETH/USDT) followed a similar pattern, rising 0.47% to $2,024 after touching a low of $2,002, but has shed 11.83% over the monthly timeframe. Key technical indicators paint a concerning picture: BTC’s 14-day RSI sits at 29.3, while ETH’s RSI is even lower at 28.1, both firmly in oversold territory. Trading volumes have collapsed dramatically relative to the 7-day average—BTC volume is at just 0.32x and ETH at 0.19x—suggesting a lack of conviction in the current bounce. The weekly performance remains negative for both assets, with BTC down 3.71% and ETH down 4.43%, as the broader market continues to digest the recent sharp declines from multi-week highs of $78,080 (BTC) and $2,142 (ETH).
Bitcoin Analysis
TradingView Live (4h)
Bitcoin’s price action on May 30 reflects a market caught between oversold technical conditions and deteriorating short-term momentum. After hitting a 7-day low of $72,512 earlier this week, BTC has managed a modest recovery to $73,906, but the bounce lacks vigor. The 24-hour range is extremely narrow—just $694 between high and low—indicating indecision and low participation. Volume at 0.32x the 7-day average confirms that institutional and retail interest has waned significantly during this corrective phase.
From a technical perspective, Bitcoin is trading below both its key moving averages: the 7-day MA at $75,107 and the 30-day MA at $78,174. This bearish alignment—where shorter-term averages sit below longer-term averages—is a classic sign of a downtrend in motion. The 30-day MA at $78,174 now acts as formidable resistance, while the 7-day MA has already failed to provide support. The gap between current price and the 30-day MA ($78,174 vs. $73,906) represents a 5.8% premium that BTC would need to reclaim to signal any meaningful reversal.
The RSI at 29.3 is the most compelling technical data point today. Readings below 30 are traditionally considered oversold and can precede a bounce, but the current indicator must be interpreted with caution. In a strong downtrend, RSI can remain oversold for extended periods without a significant recovery. The fact that volume is declining alongside the RSI suggests this is a low-momentum oversold condition rather than a capitulation event—the latter would typically see volume spikes. The 7-day high of $78,080 and the 30-day high of $82,850 serve as clear resistance layers, while the recent low of $72,512 provides immediate support. A break below $72,500 would open the door to the $70,000 psychological level, which has not been tested since early May.
Ethereum Analysis
TradingView Live (4h)
Ethereum’s price action is even more concerning than Bitcoin’s, with the asset trading at $2,024 after a 30-day decline of 11.83%. The daily gain of 0.47% is marginal and fails to offset the broader weakness. ETH’s 24-hour range was a mere $24, the tightest in recent memory, reflecting extreme low volatility and a market that is waiting for a catalyst. Volume at just 0.19x the 7-day average is alarmingly low, suggesting that even the usual algorithmic and market-making activity has diminished.
ETH’s technical structure is bearish across all timeframes. The 7-day MA at $2,051 and the 30-day MA at $2,201 both sit above the current price, with the 30-day MA now 8.7% higher. The gap between these two moving averages is widening, indicating accelerating bearish momentum. The 7-day high of $2,142 and the 30-day high of $2,424 represent significant resistance zones that would require a substantial shift in sentiment to retest.
The RSI at 28.1 is even more oversold than Bitcoin’s, a rare occurrence that highlights the severity of Ethereum’s underperformance. ETH has historically led BTC during bull phases, but in this corrective environment, it is acting as a laggard. The 7-day low of $1,967 is the immediate support level; a break below this would target the $1,900 round number and potentially the $1,800 zone, which has not been tested since late 2025. It is worth noting that the RSI has been below 30 for the past three consecutive days, which is unusual and suggests that selling pressure, while persistent, is not accelerating. This could be interpreted as a slow bleed rather than a panic sell-off.
Key Technical Levels
| Asset | Support | Resistance | RSI |
|---|---|---|---|
| BTC | $72,512 | $75,107 (MA7) / $78,174 (MA30) | 29.3 (Oversold) |
| ETH | $1,967 | $2,051 (MA7) / $2,201 (MA30) | 28.1 (Oversold) |
For Bitcoin, the $72,512 level is the most critical support to watch, as it represents the 7-day low and a breakdown point that could accelerate selling. Resistance is layered: first at the 7-day MA of $75,107, then the 30-day MA at $78,174, and finally the 7-day high of $78,080. For Ethereum, support at $1,967 is the immediate floor, with resistance at $2,051 (MA7) and $2,201 (MA30). Both assets are firmly in oversold territory based on RSI readings, which historically has increased the probability of a short-term bounce, though not guaranteed.
BTC vs ETH Dynamic
The correlation between Bitcoin and Ethereum remains high, with both assets moving in lockstep over the past 24 hours—BTC up 0.61%, ETH up 0.47%. However, Ethereum’s relative weakness is evident in the 30-day performance differential: ETH has lost 11.83% versus BTC’s 5.53% decline. This divergence is notable because ETH typically outperforms BTC during bullish phases but underperforms during corrections. The ETH/BTC ratio has fallen to approximately 0.0274, near multi-month lows, indicating that capital is flowing preferentially into Bitcoin as a relative safe haven within the crypto space. The volume collapse is more severe for ETH (0.19x vs. 0.32x), suggesting that liquidity is drying up faster in the altcoin leader. This dynamic reinforces the narrative that the current market is risk-off, with traders favoring the larger, more liquid asset.
Strategy Fit
Given the current market conditions characterized by low volatility, oversold RSI readings, and declining volume, the most appropriate trading strategies are those that capitalize on range-bound price action rather than directional bets. Grid trading is particularly well-suited to this environment: with BTC oscillating between $72,512 and $75,107 and ETH between $1,967 and $2,051, a grid bot can profit from small intraday fluctuations without requiring a strong trend. The low volume environment reduces the risk of sudden volatility spikes that could break grid boundaries. Pionex’s built-in Grid Trading Bot allows users to set upper and lower price limits within these ranges and automatically execute buy-low/sell-high orders.
For those with a longer time horizon, Dollar-Cost Averaging (DCA) is a prudent approach given the oversold conditions. Accumulating BTC and ETH at current levels, while prices are below both the 7-day and 30-day moving averages, could provide favorable entry points if the market eventually recovers. Pionex’s DCA bot enables automated periodic purchases, removing emotional decision-making during this uncertain period. Trend-following strategies are not recommended today, as both assets lack a clear directional impulse—the RSI is oversold but volume is too low to confirm a reversal. A trend-following bot would likely generate whipsaw signals in this low-volatility environment. Instead, traders should monitor for a volume spike above the 7-day average, which could signal the start of a more sustainable move.
Risk Disclaimer
This market recap is for informational and educational purposes only and does not constitute financial advice, investment recommendation, or solicitation to buy or sell any digital assets. Cryptocurrency trading involves substantial risk of loss, including the potential loss of your entire investment. Past performance is not indicative of future results. The technical analysis and strategy suggestions presented here are based on historical data and current market conditions, which may change rapidly. You should consult with a qualified financial advisor and conduct your own independent research before making any trading decisions. The author and Pionex are not responsible for any trading losses incurred based on this content.
FAQ
Q: Is the RSI oversold reading a guaranteed buy signal?
A: No. An RSI below 30 indicates that the asset has been oversold in the near term, which historically can precede a bounce. However, in strong downtrends, RSI can remain oversold for extended periods without a significant recovery. It should be used in conjunction with volume analysis and support/resistance levels, not as a standalone signal.
Q: Why is trading volume so low for both BTC and ETH?
A: Low volume typically reflects market indecision and reduced participation from both retail and institutional traders. It can occur during holiday periods, after major price moves, or when the market is waiting for a catalyst such as macroeconomic data, regulatory news, or protocol upgrades. Current volume at 0.32x (BTC) and 0.19x (ETH) of the 7-day average is unusually low.
Q: What is the significance of the 7-day and 30-day moving averages?
A: The 7-day MA (short-term) and 30-day MA (medium-term) are used to gauge trend direction. When price is below both, the trend is bearish. When the 7-day MA crosses below the 30-day MA (a "death cross"), it confirms a downtrend. Currently, both BTC and ETH are below their respective MAs, and the 7-day MA is below the 30-day MA, confirming bearish alignment.
Q: How does Ethereum’s underperformance compared to Bitcoin affect the broader market?
A: Ethereum’s relative weakness suggests a risk-off sentiment among traders, as capital tends to flow into Bitcoin (the largest and most liquid asset) during uncertain times. This ETH/BTC ratio decline can also signal that altcoin season is not imminent, and that the market is prioritizing safety over higher-risk plays.
Q: What is grid trading and how does it work in this market?
A: Grid trading involves placing buy and sell orders at predetermined price intervals within a range. In a low-volatility, range-bound market like today’s, a grid bot profits from small price oscillations by buying low and selling high repeatedly. Pionex offers automated grid trading bots that can be configured with custom ranges (e.g., BTC $72,500–$75,100) to capture these small movements without requiring active monitoring.