BTC ETH Daily Recap — 2026-08-10

BTC ETH Daily Recap — 2026-08-10
Today at a Glance
Bitcoin and Ethereum both posted marginal losses on August 10, 2026, with BTC down 0.32% to $64,692 and ETH down 0.45% to $1,902. Despite the slight daily dip, both assets remain in positive territory on the weekly and monthly timeframes. BTC is up 1.85% over the past seven days and 1.43% over the past 30 days, while ETH has gained 2.23% weekly and 5.27% monthly. Trading volumes have contracted significantly—BTC volume is at 0.61x its 7-day average, and ETH at 0.69x—suggesting a quieter session with reduced participation. Both assets traded within narrow intraday ranges: BTC between $64,518 and $65,391, and ETH between $1,895 and $1,932. RSI readings show BTC at 57.6 (moderate bullish momentum) and ETH at 51.8 (neutral), indicating that neither asset is currently overextended. Price action remains contained within recent multi-week ranges as the market consolidates.
Bitcoin Analysis
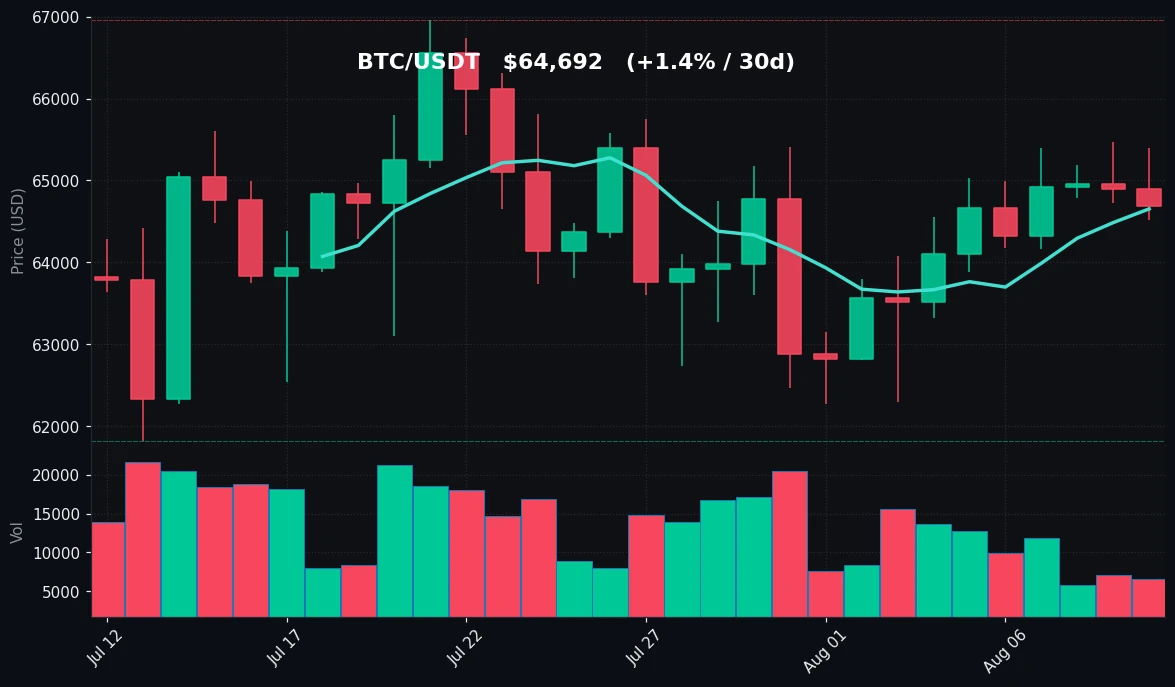
TradingView Live (4h)
Bitcoin is trading at $64,692, essentially flat over the past 24 hours. The intraday range of $64,518 to $65,391 is narrow, reflecting a low-volatility session. Over the past week, BTC has oscillated between $63,322 and $65,474, and over the past 30 days, the range extends from $61,825 to $66,956. The current price sits near the upper portion of these ranges but has not yet challenged the 30-day high.
The 7-day moving average (MA7) is $64,654, and the 30-day moving average (MA30) is $64,400. BTC is trading slightly above both, which is a constructive technical position. The gap between MA7 and MA30 is approximately $254, indicating a mild uptrend without excessive steepness. Price has held above both moving averages for the past several sessions, suggesting that short-term momentum is intact.
Volume is notably subdued at 0.61x the 7-day average. This is a meaningful contraction—traders are not aggressively participating at current levels. Low volume during a period of price stability can indicate either accumulation or a lack of directional conviction. The RSI(14) reads 57.6, which is in the upper half of the neutral-to-bullish zone but well below overbought territory (70+). This suggests there is room for upward movement without immediate overheating.
Key technical observations:
- BTC is consolidating between $63,300 and $65,500 for the past week.
- The 30-day high of $66,956 remains untested and represents a significant overhead level.
- The 30-day low of $61,825 provided strong support at the end of July.
- The current price is approximately 3.5% below the 30-day high and 4.6% above the 30-day low.
- The RSI trend has been gradually climbing from oversold levels in late July, indicating a slow recovery in momentum.
The contraction in volume combined with stable price action suggests the market is in a holding pattern. No clear breakout or breakdown signals are present in the current data.
Ethereum Analysis
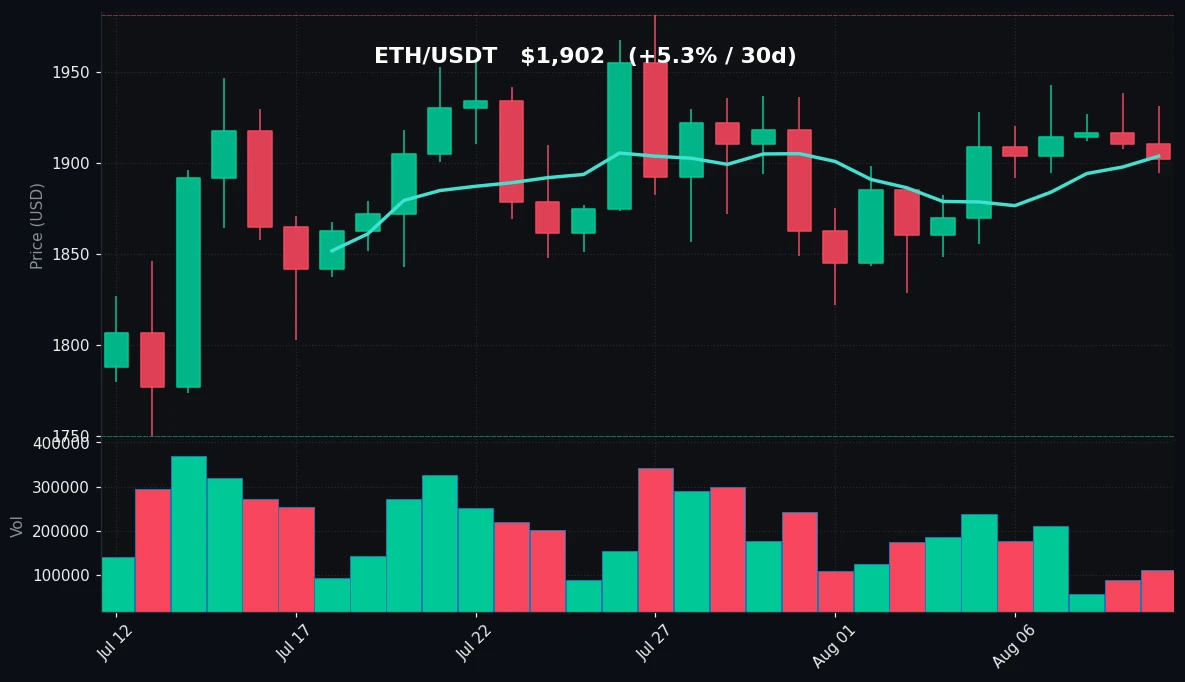
TradingView Live (4h)
Ethereum is trading at $1,902, down 0.45% on the day. The intraday range was $1,895 to $1,932, with the daily low occurring near the current price. Over the past week, ETH has ranged between $1,848 and $1,943, and over the past 30 days, between $1,750 and $1,981. The current price is near the middle of these ranges.
ETH's moving averages are closely aligned: MA7 is $1,904 and MA30 is $1,887. Price is essentially at the MA7 level and slightly above the MA30. This tight clustering of price and moving averages indicates a consolidation phase with no clear directional bias. The 30-day trend has been mildly positive, with ETH gaining 5.27% over the past month, but the recent price action shows a stall.
The RSI(14) for ETH is 51.8, which is almost perfectly neutral. This contrasts with BTC's RSI of 57.6, indicating that ETH has slightly weaker momentum. Volume is also subdued at 0.69x the 7-day average, similar to BTC's pattern. The lack of volume during this consolidation suggests that neither buyers nor sellers are committed to establishing a new trend.
Key technical observations:
- ETH has been rangebound between $1,848 and $1,943 over the past week.
- The 30-day high of $1,981 was set in mid-July, and ETH has not approached that level since.
- The 30-day low of $1,750 was a significant bounce point.
- The current price is 4.0% below the 30-day high and 8.7% above the 30-day low.
- The MA7 and MA30 are converging, which often precedes a volatility expansion.
- ETH's RSI has been oscillating in the 45-55 range for the past two weeks, indicating a lack of momentum.
The convergence of moving averages and neutral RSI suggests that ETH is building a base. However, without volume, there is insufficient data to suggest an imminent directional move.
Key Technical Levels
| Asset | Support | Resistance | RSI |
|---|---|---|---|
| BTC | $63,322 (7d low) / $61,825 (30d low) | $65,474 (7d high) / $66,956 (30d high) | 57.6 (neutral-bullish) |
| ETH | $1,848 (7d low) / $1,750 (30d low) | $1,943 (7d high) / $1,981 (30d high) | 51.8 (neutral) |
For BTC, the immediate support is the 7-day low of $63,322, followed by the more significant 30-day low at $61,825. On the upside, resistance sits at the 7-day high of $65,474, with the 30-day high of $66,956 as the next major barrier. The RSI of 57.6 suggests moderate bullish momentum without being overbought.
For ETH, support is at the 7-day low of $1,848, with the 30-day low of $1,750 as a deeper floor. Resistance is at the 7-day high of $1,943, followed by the 30-day high of $1,981. The RSI of 51.8 indicates a fully neutral stance—no momentum advantage for either bulls or bears.
BTC vs ETH Dynamic
The correlation between BTC and ETH remains high, as evidenced by their nearly identical daily percentage changes (-0.32% vs -0.45%) and similar volume contraction patterns. Both assets are trading within their respective multi-week ranges, with BTC showing slightly stronger relative momentum (RSI 57.6 vs 51.8). ETH's 30-day performance (+5.27%) outperforms BTC's (+1.43%), but this is partly a function of ETH's deeper drawdown earlier in the period. The ETH/BTC ratio has been gradually recovering but remains below recent highs. Neither asset is leading decisively; they are moving in tandem within a broadly consolidating market. The volume patterns are also consistent—both are experiencing reduced participation relative to their 7-day averages, suggesting that traders are applying the same cautious approach to both assets. Any breakout in BTC is likely to be mirrored by ETH, though the magnitude may differ given ETH's slightly weaker momentum profile.
Strategy Fit
The current market conditions—low volatility, reduced volume, and neutral RSI readings—favor range-bound trading strategies over trend-following approaches. Both BTC and ETH are trading within well-defined multi-week ranges, with the midpoint of these ranges roughly corresponding to current prices.
For traders, a grid trading strategy appears well-suited to this environment. By placing buy and sell orders at regular intervals within the established range, a grid bot can capture profits from the oscillation between support and resistance levels. The key ranges to consider are $63,300-$65,500 for BTC and $1,850-$1,940 for ETH. The reduced volume suggests that these ranges may persist until a catalyst emerges.
Dollar-cost averaging (DCA) remains a valid approach for longer-term accumulation, particularly given that both assets are above their 30-day moving averages and in the middle of their ranges. The absence of overbought or oversold conditions means that DCA entries are neither particularly favorable nor unfavorable.
Trend-following strategies are less appropriate today, as neither asset is exhibiting a clear directional trend. The moving averages are flat or converging, and RSI is neutral. Attempting to trade breakouts without volume confirmation would be speculative.
Pionex offers built-in grid trading bots that can automate this range-bound strategy, as well as DCA bots for systematic accumulation. The platform's trading bots can execute these strategies 24/7 without manual intervention, which is particularly useful during low-volume periods when opportunities are less frequent but still present.
Risk Disclaimer
This market recap is for informational and educational purposes only and does not constitute financial advice, investment advice, trading advice, or any other form of professional advice. Cryptocurrency markets are highly volatile and involve substantial risk of loss. Past performance is not indicative of future results. The data presented here is based on publicly available information at the time of writing and may contain errors or omissions. You should consult with a qualified financial advisor before making any investment decisions. Never invest money you cannot afford to lose. The author and publisher of this content bear no responsibility for any financial losses incurred as a result of acting on the information provided herein.
FAQ
Is $64,692 a strong resistance level for BTC?
No, $64,692 is the current trading price, not a resistance level. The nearest resistance levels are $65,474 (7-day high) and $66,956 (30-day high). Support levels are at $63,322 (7-day low) and $61,825 (30-day low).
Why is ETH's RSI lower than BTC's RSI?
ETH's RSI is 51.8 compared to BTC's 57.6. This indicates that ETH has slightly weaker short-term momentum. This could be due to ETH's larger 30-day gain (+5.27%) which may have already priced in some of the upward movement, or simply different supply/demand dynamics in the two markets.
What does a volume of 0.61x the 7-day average mean for BTC?
It means that current trading volume is only 61% of the average volume over the past seven days. This indicates significantly reduced market participation. Low volume often precedes a volatility expansion, but it can also mean that the current price range is being accepted by the market without much disagreement.
Are the moving averages bullish or bearish for BTC?
BTC is trading above both the MA7 ($64,654) and MA30 ($64,400). This is a mildly bullish signal. However, the small gap between the two moving averages suggests the trend is not strong. A bearish signal would occur if price fell below both moving averages, particularly if the MA7 crossed below the MA30.
How should I interpret the neutral RSI readings?
An RSI near 50 (like ETH's 51.8) indicates that gains and losses are roughly balanced over the lookback period. It means there is no strong momentum in either direction. For BTC, an RSI of 57.6 indicates mild bullish momentum but is far from the overbought threshold of 70. These readings are consistent with a consolidating market where neither bulls nor bears have a decisive advantage.


