BTC ETH Daily Recap — 2026-08-16

BTC ETH Daily Recap — 2026-08-16
Today at a Glance
The crypto market is treading water today, August 16, 2026, with both Bitcoin and Ethereum showing negligible 24-hour movement. Bitcoin (BTC) is trading at $63,060, essentially flat (-0.04%) within a tight intraday range of $62,968–$63,159. The asset continues its broader consolidation phase, down 2.84% over the past week and 2.74% over the past month. Ethereum (ETH) mirrors this stagnation, holding at $1,882 with the same -0.04% 24-hour change, though its weekly performance is slightly better at -1.50%. Notably, ETH has managed a modest +1.04% gain over 30 days, outperforming BTC. Trading volumes have collapsed dramatically—both assets are trading at roughly 20% of their 7-day average volume—signaling a pronounced lack of participation. RSI readings (BTC: 43.9, ETH: 48.9) place both assets in neutral territory, neither oversold nor overbought. The market appears to be in a holding pattern, awaiting a catalyst.
Bitcoin Analysis
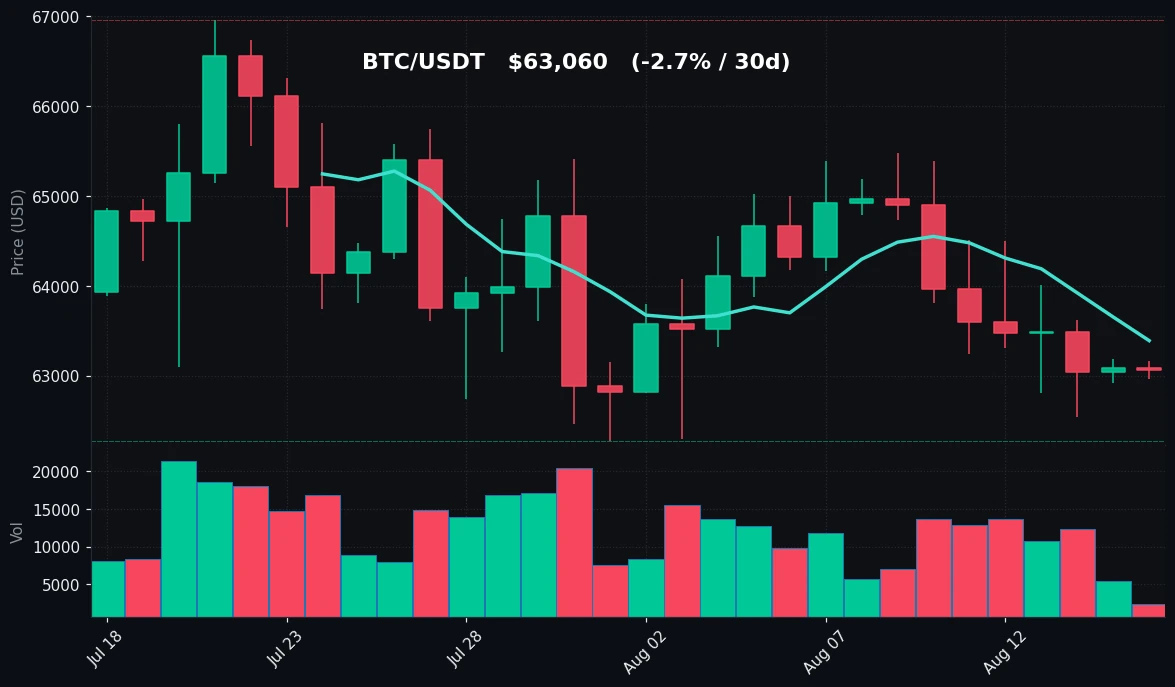
TradingView Live (4h)
Bitcoin is exhibiting a classic consolidation pattern, characterized by declining volatility and compressed trading ranges. The current price of $63,060 sits just below the 7-day moving average of $63,390, indicating mild short-term bearish pressure. The 30-day moving average at $64,245 remains above the spot price, confirming a broader downtrend that has persisted over the past month. The gap between these two moving averages (~$1,185) suggests that sellers have maintained control, though the narrowing distance between price and MA30 hints at a potential convergence.
The weekly range has been particularly telling: BTC oscillated between a high of $65,391 and a low of $62,535. The upper boundary of this range aligns with the 30-day MA, creating a confluence of resistance. The lower boundary at $62,535 has been tested but held, establishing a critical support zone. Within the daily timeframe, the tight $191 range ($62,968–$63,159) demonstrates that neither bulls nor bears have been able to assert dominance.
Volume analysis reveals a stark picture: current trading volume is just 0.22x the 7-day average. This represents an 80% reduction in participation, which typically precedes a volatility expansion. Low-volume environments often lead to sharp moves when liquidity returns, but the direction remains ambiguous. The RSI at 43.9 sits in neutral territory, slightly below the 50 midline, reflecting the mild bearish tilt without reaching oversold conditions (below 30).
Looking at the broader 30-day context, Bitcoin has established a descending range with lower highs ($66,956 → $65,391) and relatively stable lows ($62,275 → $62,535). This pattern suggests accumulation near the lows, but without volume confirmation, it is premature to call a reversal. The current price action is best characterized as a pause within a larger consolidation phase—a period where the market is building energy for its next directional move. Technical indicators remain mixed: moving averages still point south, but RSI neutrality and stabilizing lows offer a counter-narrative.
Ethereum Analysis
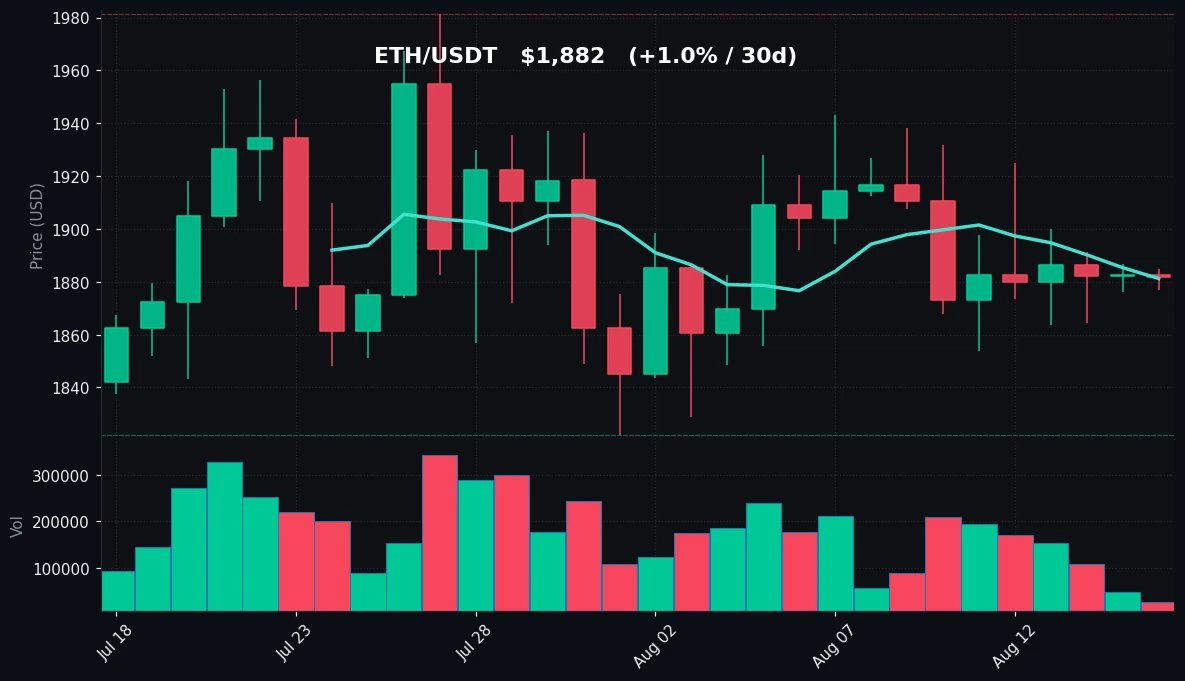
TradingView Live (4h)
Ethereum is displaying a slightly different technical picture than Bitcoin, showing relative resilience despite the overall market lethargy. ETH trades at $1,882, nearly identical to its 7-day moving average of $1,881, indicating a state of equilibrium. The 30-day MA at $1,892 is only $10 above the current price, suggesting that ETH has effectively "caught up" to its medium-term average—a sign that the recent consolidation may be nearing its conclusion.
The weekly performance of -1.50% is notably better than BTC's -2.84%, and the 30-day gain of +1.04% versus BTC's -2.74% highlights a clear divergence in relative strength. ETH has established a weekly range of $1,854–$1,932, with the lower boundary representing a critical support level that has been tested multiple times without breaking. The 30-day range ($1,822–$1,981) shows a similar pattern of higher lows, which is technically constructive.
Volume conditions for ETH are even more subdued than BTC, with current volume at just 0.19x the 7-day average. This extreme low-volume environment means that price movements are not being driven by conviction but rather by the absence of sellers and buyers alike. The RSI at 48.9 is almost perfectly neutral, slightly above BTC's reading, reinforcing the narrative that ETH is in a more balanced position.
The relationship between ETH's moving averages deserves attention: the spot price is essentially intertwined with both MA7 and MA30, creating a rare state of technical alignment. When moving averages converge this closely, it often signals that a breakout is pending, as the market has compressed volatility to an extreme degree. The 30-day high of $1,981 and low of $1,822 establish the outer boundaries of this compression zone.
ETH's relative outperformance against BTC over the past month suggests that capital rotation may be favoring Ethereum. However, without volume confirmation, this remains a speculative observation. The technical structure indicates that ETH is at a decision point—the tight range between $1,854 and $1,932 represents the battleground where the next trend will be determined.
Key Technical Levels
| Asset | Support | Resistance | RSI |
|---|---|---|---|
| BTC | $62,535 | $65,391 | Neutral (43.9) |
| ETH | $1,854 | $1,932 | Neutral (48.9) |
BTC vs ETH Dynamic
The correlation between Bitcoin and Ethereum remains high, as evidenced by their identical 24-hour percentage changes (-0.04%). However, the medium-term divergence is notable: over the past 30 days, ETH has gained +1.04% while BTC has lost -2.74%, a relative outperformance of nearly 3.8 percentage points. This divergence suggests that ETH is either being accumulated independently or that BTC is facing specific selling pressure. The 7-day performance gap (-1.50% vs -2.84%) further confirms this trend. While both assets are in consolidation, ETH's stronger positioning near its moving averages and its positive monthly performance indicate that the ETH/BTC ratio is trending upward. In a low-volume environment, this relative strength could either signal the beginning of an altseason rotation or simply reflect different liquidity dynamics between the two markets. The persistent correlation in daily moves, however, reminds us that systemic factors still dominate crypto asset pricing.
Strategy Fit
The current market conditions—characterized by extreme low volatility, compressed ranges, and neutral RSI readings—favor specific trading strategies over others. Bitcoin's 7-day range of $2,856 (4.5% from low to high) and Ethereum's $78 range (4.2%) are both relatively narrow, suggesting that trend-following strategies would struggle to generate meaningful returns. Similarly, breakout strategies face the risk of false signals given the low volume environment.
Range-bound trading, particularly grid trading, appears best suited to the current conditions. With BTC oscillating between $62,535 and $65,391 and ETH between $1,854 and $1,932, a grid bot could systematically buy at support levels and sell at resistance, capturing small profits from the ongoing consolidation. Pionex's built-in grid trading bots are designed precisely for such conditions, automatically placing buy and sell orders within a defined price range. The low volatility reduces the risk of grid positions being run over by a sharp move, while the established range provides clear parameters for grid boundaries.
Dollar-cost averaging (DCA) also remains a viable strategy for longer-term holders, particularly given the neutral RSI readings that suggest neither overbought nor oversold conditions. However, given the compressed volatility, DCA benefits are diminished compared to periods of higher price dispersion. Trend-following strategies should be avoided until volume returns and a clear directional bias emerges. The most prudent approach in this environment is to deploy range-bound strategies with defined risk parameters, allowing the market's natural oscillation to generate returns while waiting for a volatility expansion.
Risk Disclaimer
This market recap is provided for informational and educational purposes only. It does not constitute financial advice, investment advice, trading advice, or any other form of professional advice. All content, including market analysis, technical indicators, and strategy discussions, reflects the author's interpretation of publicly available data and should not be relied upon as the basis for any investment decision. Cryptocurrency markets are highly volatile and involve substantial risk of loss. Past performance is not indicative of future results. You should consult with a qualified financial advisor before making any investment decisions. The author and publisher accept no liability for any losses incurred as a result of acting on information contained in this document.
FAQ
What is causing the extremely low trading volume on August 16, 2026?
The current volume levels (0.22x and 0.19x of the 7-day average for BTC and ETH respectively) suggest a market-wide reduction in participation. This could be attributed to a weekend effect, a lack of major news catalysts, or market participants waiting for clearer directional signals. Low volume environments often precede volatility expansions, but the timing and direction remain uncertain.
Why is Ethereum outperforming Bitcoin over the past 30 days?
ETH has gained +1.04% while BTC has declined -2.74% over the past month. This relative outperformance may reflect capital rotation toward Ethereum, differences in derivatives positioning, or simply the fact that ETH experienced a deeper correction earlier and is now stabilizing. The 30-day low of $1,822 for ETH versus its current price of $1,882 shows a recovery from the lows.
What does the RSI reading of 43.9 for Bitcoin indicate?
An RSI of 43.9 for BTC places it in neutral territory, slightly below the 50 midline. This suggests that while there is mild selling pressure, the asset is not oversold (which would be below 30) nor overbought (above 70). The neutral RSI indicates that momentum is balanced and that the market lacks a strong directional bias.
How should traders interpret the narrowing gap between price and moving averages?
When the spot price converges with both the 7-day and 30-day moving averages, as seen with ETH ($1,882 vs MA7 $1,881 and MA30 $1,892), it often signals that a period of high volatility is approaching. This compression reflects declining momentum in both directions and typically resolves with a breakout. However, the direction of the breakout cannot be determined from this indicator alone.
Are grid trading bots appropriate in the current market conditions?
Yes, the current range-bound conditions with clear support and resistance levels are well-suited for grid trading. With BTC ranging between $62,535 and $65,391 and ETH between $1,854 and $1,932, grid bots can systematically profit from the oscillation. Pionex's built-in grid trading bots automate this process, removing the need for manual order placement. However, traders should set appropriate range boundaries and risk parameters, as a breakout beyond the established range could result in losses.


