BTC ETH Daily Recap — 2026-08-15

BTC ETH Daily Recap — 2026-08-15
Today at a Glance
Bitcoin and Ethereum both entered a pronounced consolidation phase on August 15, 2026, with 24‑hour changes near zero (+/‑0.03%). BTC traded in a narrow $268 range ($62,920–$63,188) and settled at $63,034, while ETH moved just $11 intraday ($1,876–$1,887) to close at $1,883. The broader weekly picture remains slightly negative for both assets: BTC is down 2.97% over seven days, ETH down 1.77%. However, the monthly divergence is notable—BTC is off 1.40% over 30 days, whereas ETH has gained 2.21% in the same period. Trading activity has collapsed to 0.32x (BTC) and 0.20x (ETH) of their respective 7‑day average volumes, indicating extremely low participation. RSI readings (BTC 52.2, ETH 59.6) sit in neutral‑to‑mildly‑bullish territory, suggesting neither asset is overbought nor oversold. The market is effectively waiting for a directional catalyst.
Bitcoin Analysis
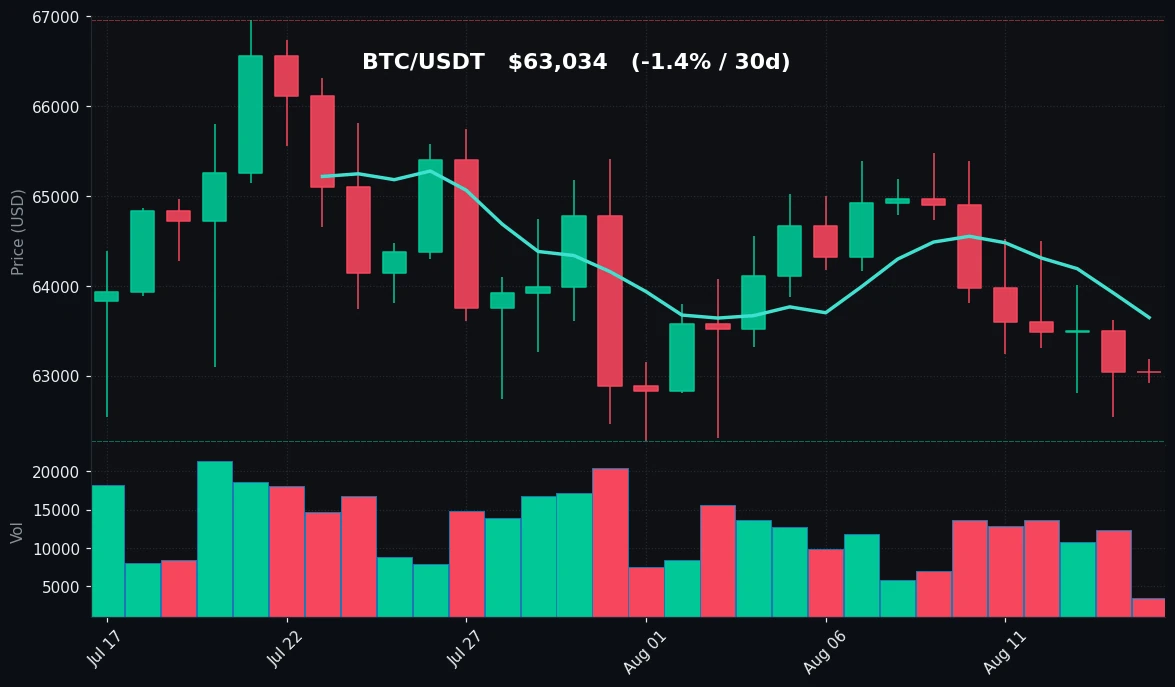
TradingView Live (4h)
Bitcoin’s price action over the past 24 hours is best described as range‑bound with a slight negative bias. The asset opened near $63,050, touched a high of $63,188, and dipped to a low of $62,920 before settling at $63,034—a net change of just ‑0.01%. This micro‑range of $268 is the tightest observed in the past week, reflecting a standoff between buyers and sellers.
The seven‑day trajectory shows a clear downtrend from the weekly high of $65,474 to the current level, with a weekly low of $62,535 recorded earlier. The 30‑day picture is similarly subdued: BTC has oscillated between $62,275 and $66,956, and the current price sits near the lower third of that range. Notably, the 30‑day low of $62,275 is only ~1.2% below today’s close, suggesting that the market is testing a critical demand zone.
Moving averages provide a mixed signal. The 7‑day MA ($63,646) is above the current price, indicating short‑term bearish momentum. The 30‑day MA ($64,272) is even higher, reinforcing that the asset has been losing ground over the past month. However, the gap between the two MAs is narrowing—from ~$800 a week ago to ~$626 today—which may indicate that the downtrend is losing steam.
Volume analysis is the most striking feature. Today’s trading volume is only 0.32x the 7‑day average, meaning that participation has dropped by roughly two‑thirds. Such low volume often precedes a volatility expansion, but it also makes the current price levels less reliable as true fair value. The RSI at 52.2 is neutral, hovering just above the 50 midline, and does not signal any momentum edge in either direction.
Key technical levels to monitor: immediate support at $62,920 (today’s low) and $62,535 (weekly low), with stronger support at $62,275 (30‑day low). Resistance sits at $63,646 (7‑day MA), $65,474 (weekly high), and $66,956 (30‑day high). The price is sandwiched between the 7‑day and 30‑day MAs, and a break in either direction will likely set the tone for the coming week.
Ethereum Analysis
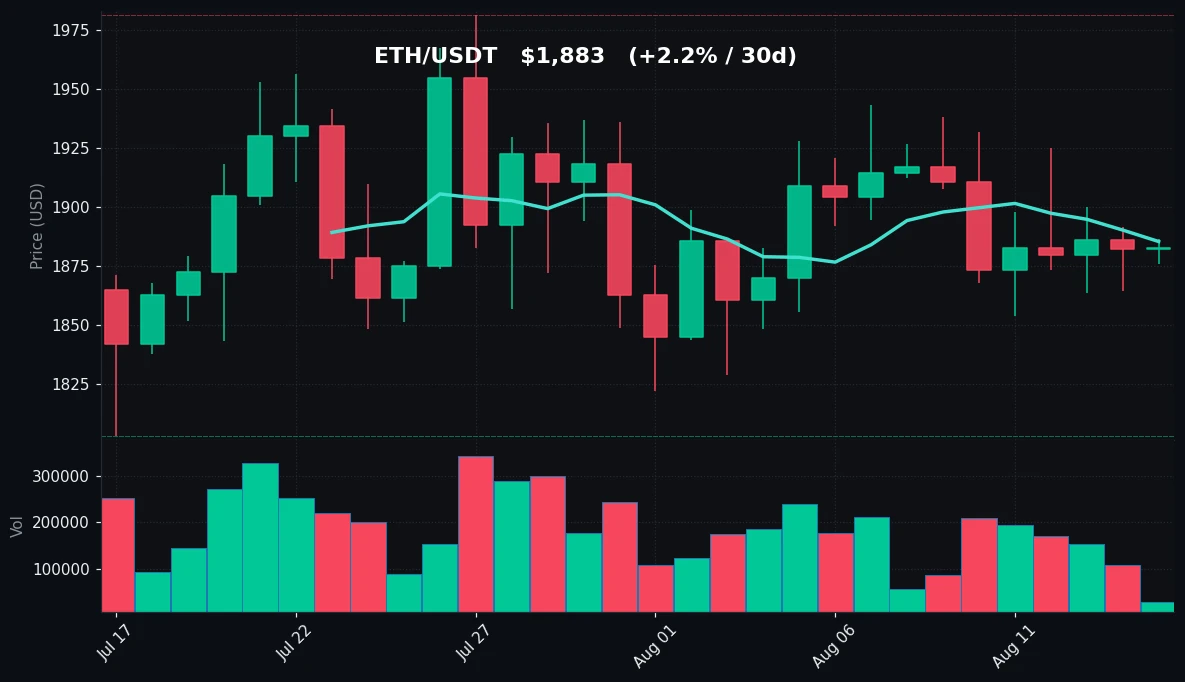
TradingView Live (4h)
Ethereum’s 24‑hour performance mirrors Bitcoin’s lethargy, with a change of +0.03% and a trading range of just $11. The asset peaked at $1,887 and bottomed at $1,876, closing at $1,883. This is the second consecutive day of sub‑$15 ranges, indicating an extreme compression of volatility.
The weekly perspective shows ETH fell from a high of $1,938 to a low of $1,854, a 4.3% decline, before recovering slightly to the current level. The 30‑day view is more constructive: ETH has gained 2.21% despite the recent pullback, and its 30‑day range ($1,803–$1,981) shows that the asset has been building a higher low structure. The current price is above the 30‑day low by 4.4%, while BTC is only 1.2% above its 30‑day low—a sign of relative strength for ETH.
Moving averages are slightly bearish in the short term. The 7‑day MA ($1,885) is marginally above the current price ($1,883), indicating a very mild downtrend. The 30‑day MA ($1,891) is also above, but the gap is only $8, meaning the market is effectively flat over the past month. This convergence of MAs is typical of a consolidation phase and often precedes a directional move.
Volume is exceptionally thin: today’s volume is just 0.20x the 7‑day average, the lowest reading among major assets. This suggests that the current price is not being validated by significant capital flows. The RSI at 59.6 is the more bullish indicator, sitting above the neutral 50 level and below the overbought threshold of 70. This implies that while momentum is not explosive, it is slightly tilted to the upside.
Critical levels for ETH: support at $1,876 (today’s low), $1,854 (weekly low), and $1,803 (30‑day low). Resistance at $1,887 (today’s high), $1,938 (weekly high), and $1,981 (30‑day high). The tight MA cluster ($1,883–$1,891) acts as a pivot zone; a sustained move above $1,900 would signal a resumption of the monthly uptrend, while a break below $1,850 would negate the higher‑low structure.
Key Technical Levels
| Asset | Support | Resistance | RSI |
|---|---|---|---|
| BTC | $62,535 / $62,275 | $63,646 / $65,474 | Neutral (52.2) |
| ETH | $1,854 / $1,803 | $1,938 / $1,981 | Mildly Bullish (59.6) |
Note: Support and resistance levels are derived from the 7‑day and 30‑day high/low data provided. RSI interpretation: BTC is neutral, ETH is mildly bullish but not overbought.
BTC vs ETH Dynamic
The correlation between Bitcoin and Ethereum remains high, as evidenced by their synchronized price action over the past 24 hours (both near 0% change) and the similar weekly drawdowns (‑2.97% vs ‑1.77%). However, a subtle divergence is emerging in the monthly timeframe: ETH is up 2.21% while BTC is down 1.40%. This suggests that capital is rotating from BTC into ETH, a pattern often seen in late‑stage bear markets or early recoveries. The RSI differential (BTC 52.2 vs ETH 59.6) supports this—ETH has more relative momentum. Additionally, ETH’s 30‑day low is further from the current price (4.4%) than BTC’s (1.2%), indicating that ETH’s demand zone is more robust. Traders should watch whether this divergence persists; if BTC breaks below $62,275 while ETH holds $1,854, it would confirm a decoupling. Conversely, a coordinated bounce would signal a broad market reversal.
Strategy Fit
Given the current market microstructure—extremely low volume (0.20–0.32x average), tight ranges, and neutral RSI—directional strategies are likely to underperform. The optimal approach is a grid trading strategy that capitalizes on the established ranges. For BTC, a grid between $62,500 and $63,700 (the 7‑day MA and recent support) would capture the expected oscillation. For ETH, a grid between $1,860 and $1,920 (between the weekly low and the 7‑day high) is suitable. These ranges are well‑defined by the technical levels above.
DCA (Dollar‑Cost Averaging) is also viable, but the current flat price action means that the average entry price will be very close to the spot price, offering little advantage over a lump‑sum entry. Trend‑following strategies are not recommended due to the lack of a clear directional bias.
Pionex’s built‑in trading bots are particularly well‑suited for this environment. The Grid Bot can automatically execute buy‑low/sell‑high orders within the specified ranges, requiring no manual intervention. The Spot DCA Bot can be set to accumulate ETH or BTC at fixed intervals, taking advantage of the low volatility to build positions without timing the market. The Rebalancing Bot can also be used to maintain a fixed ratio between BTC and ETH, profiting from the relative strength divergence. Given the volume drought, traders should keep position sizes modest and ensure that grid spacing is wide enough to avoid excessive fills.
Risk Disclaimer
This market recap is for informational and educational purposes only and does not constitute financial, investment, or trading advice. Cryptocurrency markets are highly volatile and involve substantial risk of loss. Past performance, including all data presented above, is not indicative of future results. The technical levels, RSI readings, and volume analysis are based on historical data and may not predict future price movements. You should conduct your own research and consult with a qualified financial advisor before making any investment decisions. The author and publisher are not responsible for any financial losses incurred as a result of acting on the information provided herein. Trading and investing in digital assets may not be suitable for all investors. Never invest money you cannot afford to lose.
FAQ
What is the main reason for the extremely low trading volume on 2026-08-15?
The volume readings of 0.32x (BTC) and 0.20x (ETH) relative to the 7‑day average indicate a significant drop in market participation. This is often caused by a lack of major news catalysts, a weekend effect, or institutional traders waiting for clearer signals. Low volume typically leads to tighter ranges and can precede a volatility expansion.
Is an RSI of 52.2 for BTC and 59.6 for ETH a bullish or bearish signal?
Both readings are in the neutral zone (30–70). BTC at 52.2 is essentially flat, showing no momentum in either direction. ETH at 59.6 is mildly bullish, suggesting that buyers have a slight edge, but it is far from the overbought threshold of 70. Neither asset is at risk of an immediate reversal due to extreme momentum.
How should I interpret the difference between the 7‑day and 30‑day moving averages?
For BTC, the 7‑day MA ($63,646) is above the 30‑day MA ($64,272), meaning the short‑term trend is below the longer‑term average—a bearish sign. For ETH, the MAs ($1,885 vs $1,891) are nearly converged, indicating a flat market. A cross of the 7‑day MA above the 30‑day MA would be a bullish signal, but that has not occurred yet.
What are the key support and resistance levels to watch for a breakout?
For BTC: support at $62,535 (weekly low) and $62,275 (30‑day low); resistance at $63,646 (7‑day MA) and $65,474 (weekly high). For ETH: support at $1,854 (weekly low) and $1,803 (30‑day low); resistance at $1,938 (weekly high) and $1,981 (30‑day high). A break above resistance or below support on above‑average volume would signal a new trend.
Can I use Pionex bots in this market condition, and which bot is best?
Yes, Pionex bots are ideal for low‑volatility, range‑bound markets. The Grid Bot is the best choice because it automatically buys at support and sells at resistance within a predefined range. For BTC, set a grid between $62,500 and $63,700; for ETH, between $1,860 and $1,920. The Spot DCA Bot is also suitable for accumulating positions over time. Avoid trend‑following bots until a clear breakout occurs.


