BTC ETH Daily Recap — 2026-08-14

BTC ETH Daily Recap — 2026-08-14
Today at a Glance
Bitcoin and Ethereum both traded lower on August 14, 2026, with BTC leading the decline. Bitcoin fell 1.30% over the past 24 hours to $62,669, touching a session low of $62,605 before finding marginal buying interest. Ethereum showed relative resilience, slipping 0.85% to $1,870, with its 30-day performance still marginally positive at +0.29%. Volume conditions were notably subdued across both assets — BTC traded at 0.7x its 7-day average volume, while ETH volume compressed to just 0.42x, suggesting a low-participation session. Both assets remain below their respective 7-day and 30-day moving averages, indicating persistent short-term bearish pressure. RSI readings place BTC at 47.9 (neutral) and ETH at 51.6 (neutral), with neither asset exhibiting momentum extremes. The broader picture shows a market consolidating after recent declines, with BTC down 3.47% over the week and ETH down 2.31%.
Bitcoin Analysis
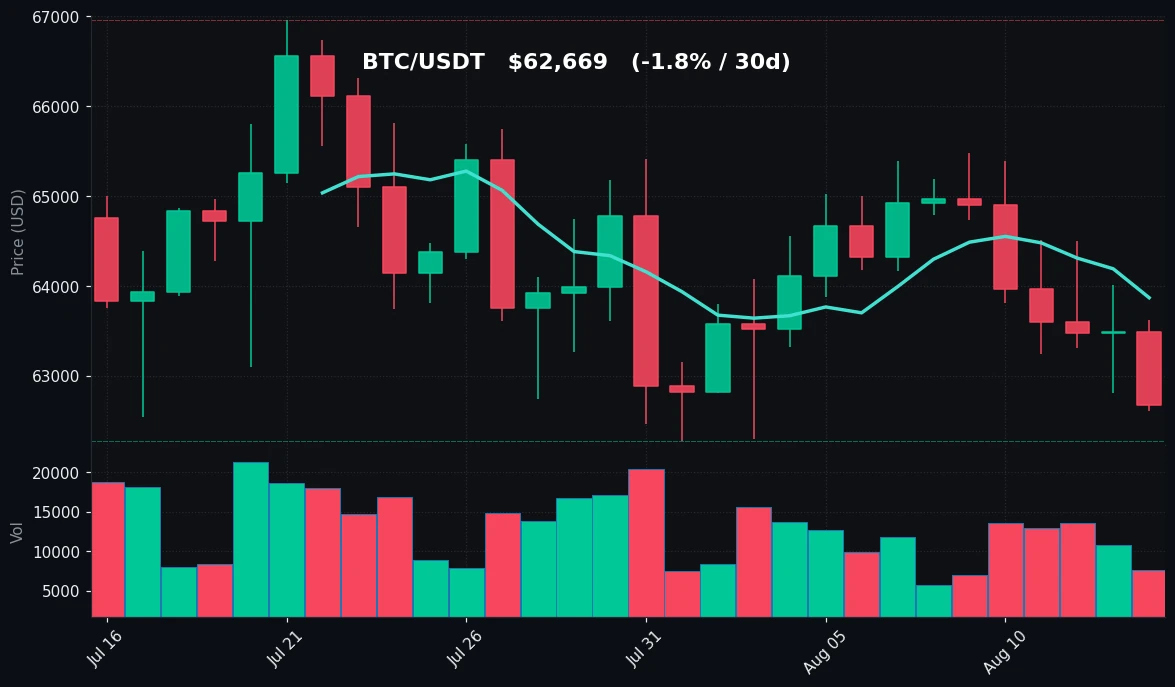
TradingView Live (4h)
Bitcoin’s price action on August 14 reflects a continued drift lower within a well-defined range. The asset closed the 24-hour window at $62,669, having tested a low of $62,605 — a level that coincides with the recent 30-day low of $62,275, suggesting sellers are probing key demand zones. The intraday high of $63,617 was rejected, and BTC was unable to reclaim its 7-day moving average of $63,868, which now acts as immediate overhead resistance. The 30-day moving average at $64,286 sits further above, reinforcing the near-term bearish structure.
The weekly range shows BTC between $62,605 and $65,474, with the current price residing in the lower quartile of that band. Over the past 30 days, the asset has oscillated between $62,275 and $66,956, indicating a broad consolidation phase rather than a directional breakout. The proximity of the current price to the 30-day low is noteworthy — a break below $62,275 would open a fresh downside leg, while sustained defense of this level could set up a base for a rebound.
Volume analysis reveals a concerning lack of conviction. Trading volume at 0.7x the 7-day average indicates reduced participation, which often precedes either a sharp move or continued drift depending on positioning. Low volume during a decline can signal seller exhaustion, but it also means buyers are not aggressively stepping in. The RSI at 47.9 sits just below the neutral 50 mark, confirming that momentum is neither oversold nor overbought — the market is in a state of equilibrium with a slight bearish tilt.
Key technical levels to monitor include immediate support at $62,605 (today’s low) followed by $62,275 (30-day low). On the upside, resistance is clustered at $63,617 (today’s high), $63,868 (MA7), and $64,286 (MA30). The consolidation pattern suggests that a decisive move beyond $62,275 or $64,286 will likely set the tone for the coming sessions.
Ethereum Analysis
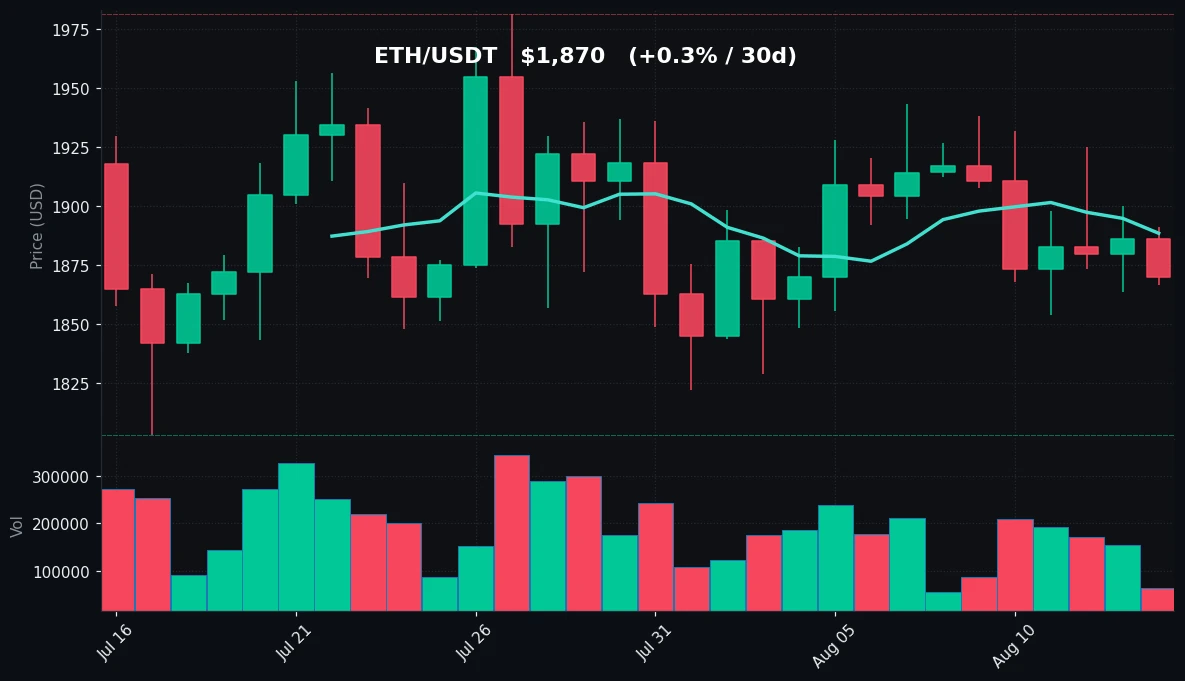
TradingView Live (4h)
Ethereum demonstrated relative strength compared to Bitcoin on August 14, with a modest 0.85% decline to $1,870. The asset traded within a narrow band between $1,866 and $1,891, reflecting low volatility and indecision. Notably, ETH’s 30-day performance remains positive at +0.29%, a contrast to BTC’s -1.82% over the same period, indicating that Ethereum has been holding up better in the recent consolidation phase.
The technical structure for ETH shows price sitting just below both its 7-day MA ($1,888) and 30-day MA ($1,890). The convergence of these two moving averages at roughly the same level creates a dense resistance zone between $1,888 and $1,890. A daily close above this cluster would signal a shift toward bullish momentum. Conversely, the 7-day low of $1,854 and 30-day low of $1,803 provide the downside reference points.
Ethereum’s RSI at 51.6 is marginally above neutral, indicating slightly stronger momentum than BTC. However, the volume picture is notably weak — trading at just 0.42x the 7-day average, the lowest relative volume among major assets. This suggests that current price levels are not attracting significant participation, and the market may be waiting for a catalyst to establish direction.
The 30-day range for ETH spans $1,803 to $1,981, with the current price positioned near the middle of this band. This contrasts with BTC, which sits near the bottom of its range, highlighting ETH’s relative resilience. The weekly range of $1,854 to $1,938 shows that ETH has been unable to reclaim its weekly highs, but has also avoided making new lows.
For traders, the key levels to watch are support at $1,854 (7-day low) and $1,803 (30-day low), with resistance at $1,891 (today’s high) and the $1,888–$1,890 MA cluster. A break above the moving averages could trigger a move toward the 30-day high of $1,981, while a breakdown below $1,854 would shift focus to the $1,803 support.
Key Technical Levels
| Asset | Support | Resistance | RSI |
|---|---|---|---|
| BTC | $62,275 | $64,286 | Neutral (47.9) |
| ETH | $1,803 | $1,890 | Neutral (51.6) |
BTC vs ETH Dynamic
The correlation between Bitcoin and Ethereum remains elevated, as both assets moved lower in tandem on August 14. However, the magnitude of the decline differed meaningfully — BTC fell 1.30% while ETH declined just 0.85%. This divergence is consistent with ETH’s stronger 30-day performance (+0.29% vs -1.82% for BTC) and suggests that Ethereum is exhibiting relative strength in the current environment. The volume disparity is also notable: BTC traded at 0.7x its average while ETH traded at only 0.42x, indicating that the selling pressure in ETH is even lighter than in BTC. In relative terms, ETH’s RSI at 51.6 versus BTC’s 47.9 confirms that Ethereum holds a slightly more constructive momentum profile. Should Bitcoin stabilize near current levels, Ethereum may be better positioned to reclaim its moving averages first, though a sharp BTC decline would likely drag ETH lower given the persistent correlation between the two assets.
Strategy Fit
The current market conditions — low volume, neutral RSI, and price hovering near key support levels — favor range-bound strategies over directional bets. Bitcoin’s consolidation between $62,275 and $64,286, combined with reduced volatility, creates an environment where grid trading strategies can capture small price oscillations without the risk of a sharp breakout. The proximity of BTC to its 30-day low adds some downside risk, but the lack of volume suggests limited momentum in either direction.
Ethereum’s even lower volume (0.42x average) and narrow trading range make it a candidate for DCA (dollar-cost averaging) strategies, particularly for investors looking to accumulate at current levels. The neutral RSI readings on both assets indicate that there is no immediate momentum edge, favoring mean-reversion approaches over trend-following.
For traders using Pionex’s built-in bots, the current conditions are well-suited for grid bots on both BTC and ETH, given the defined ranges and lack of directional bias. The low volume environment reduces the risk of grid positions being run over by a sudden spike. Alternatively, a DCA bot could be deployed on ETH, given its relative strength and proximity to moving averages. Trend-following strategies are less appropriate today, as neither asset is exhibiting a clear directional move, and the low volume suggests that any breakout would lack conviction.
Risk Disclaimer
This market recap is for informational and educational purposes only and does not constitute financial advice, investment advice, trading advice, or any other type of professional advice. Cryptocurrency markets are highly volatile and involve substantial risk of loss. Past performance is not indicative of future results. You should not make any investment decisions based solely on the information provided in this document. Always conduct your own research, consider your financial situation and risk tolerance, and consult with a qualified financial advisor before making any investment decisions. The author and publisher of this document are not responsible for any financial losses incurred as a result of acting on the information presented herein.
FAQ
What is the current price of Bitcoin?
Bitcoin (BTC) is trading at $62,669 as of August 14, 2026, down 1.30% over the past 24 hours.
What is the current price of Ethereum?
Ethereum (ETH) is trading at $1,870 as of August 14, 2026, down 0.85% over the past 24 hours.
Are Bitcoin and Ethereum in an overbought or oversold condition?
Neither asset is in overbought or oversold territory. Bitcoin’s RSI is 47.9 and Ethereum’s RSI is 51.6, both in neutral territory.
What are the key support levels for BTC and ETH?
Bitcoin’s key support is at $62,275 (30-day low), while Ethereum’s key support is at $1,803 (30-day low).
Why is trading volume so low today?
Both BTC and ETH are trading below their 7-day average volumes — BTC at 0.7x and ETH at 0.42x. Low volume typically indicates reduced market participation, which can occur during periods of consolidation or ahead of major news events.


