BTC ETH Daily Recap — 2026-08-04

BTC ETH Daily Recap — 2026-08-04
Today at a Glance
Bitcoin (BTC) traded in a tight range on August 4, 2026, closing near $63,868 with a modest 24-hour gain of +0.55%. The session saw a high of $64,244 and a low of $63,322, indicating that buyers and sellers remain in a standoff. BTC’s 7-day performance is nearly flat at -0.07%, while the 30-day change is -0.27%, suggesting a prolonged consolidation phase. Ethereum (ETH) underperformed BTC on the week, down -2.89% over 7 days, though it retains a positive 30-day return of +3.73%. ETH traded at $1,867, up +0.33% on the day, with a range of $1,848–$1,882. Both assets saw significantly reduced trading volumes—approximately 55% of their 7-day averages—pointing to thinning liquidity and a cautious market posture. RSI levels remain in neutral-to-oversold territory for BTC (35.8) and neutral for ETH (42.6), offering no immediate directional confirmation.
Bitcoin Analysis
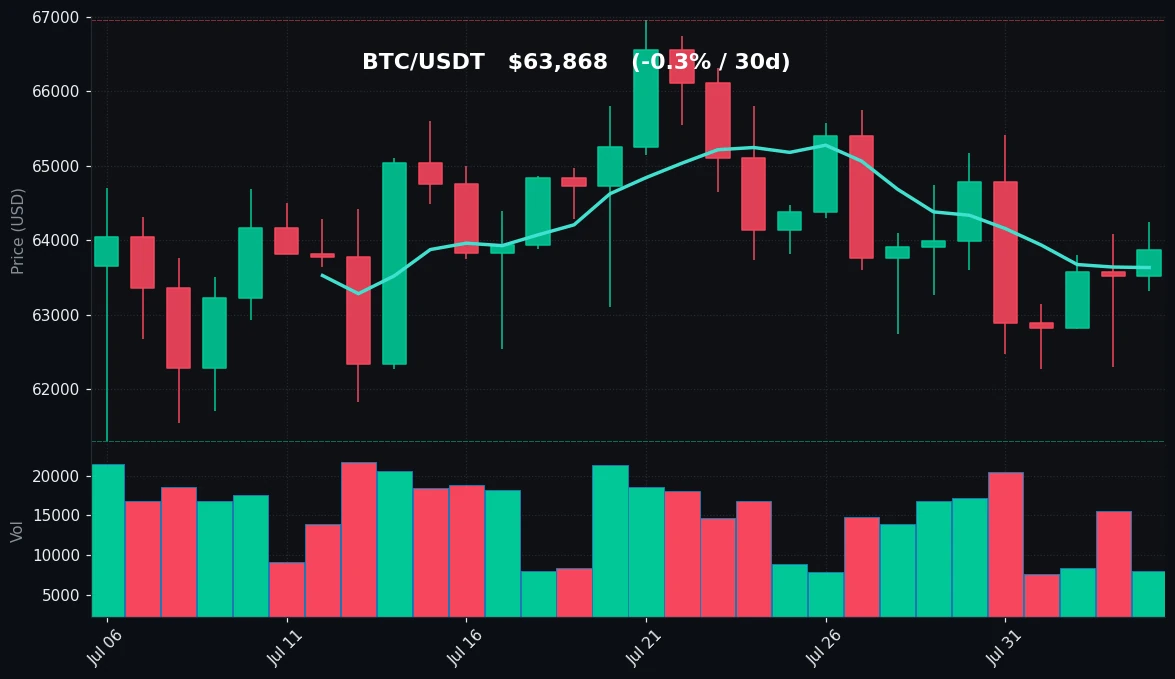
TradingView Live (4h)
Bitcoin’s price action on August 4, 2026, reflects a market that is neither aggressively accumulating nor distributing. The 24-hour range of $63,322 to $64,244 is narrow, representing just 1.45% volatility, which is consistent with the broader 7-day consolidation between $62,275 and $65,410. The 30-day range extends from $61,307 to $66,956, indicating that the current price sits near the middle of this larger band.
Technically, BTC is trading above its 7-day moving average (MA7) of $63,633 but below the 30-day moving average (MA30) of $64,139. This positioning suggests that short-term momentum is slightly positive, but the medium-term trend remains unresolved. The price has been oscillating around these moving averages for the past week, creating a classic “flat” or “sideways” technical structure.
The Relative Strength Index (RSI) at 35.8 is notable. This is below the neutral 50 level and approaches the oversold threshold of 30. While not in extreme oversold territory, this reading indicates that selling pressure has been dominant over the past 14 days, yet without producing a significant price decline. This divergence—low RSI with flat price—often occurs during distribution phases or when buyers absorb selling at key support levels.
Volume is a critical concern. Current trading volume is only 0.56x the 7-day average, meaning activity has nearly halved. Low volume during a consolidation phase reduces the reliability of both support and resistance levels, as thin order books can lead to sudden, sharp movements. The reduced participation may be attributed to macro uncertainty or a seasonal lull.
Key support is visible at $62,275, the 7-day low, with secondary support at $61,307 (30-day low). Resistance sits at $64,244 (24h high) and more firmly at $65,410 (7-day high). The MA30 at $64,139 also acts as dynamic resistance. The current structure does not favor aggressive directional bets; instead, it suggests a market waiting for a catalyst. The lack of volume combined with declining RSI often precedes a volatility expansion, but the direction remains undetermined based on the data provided.
Ethereum Analysis
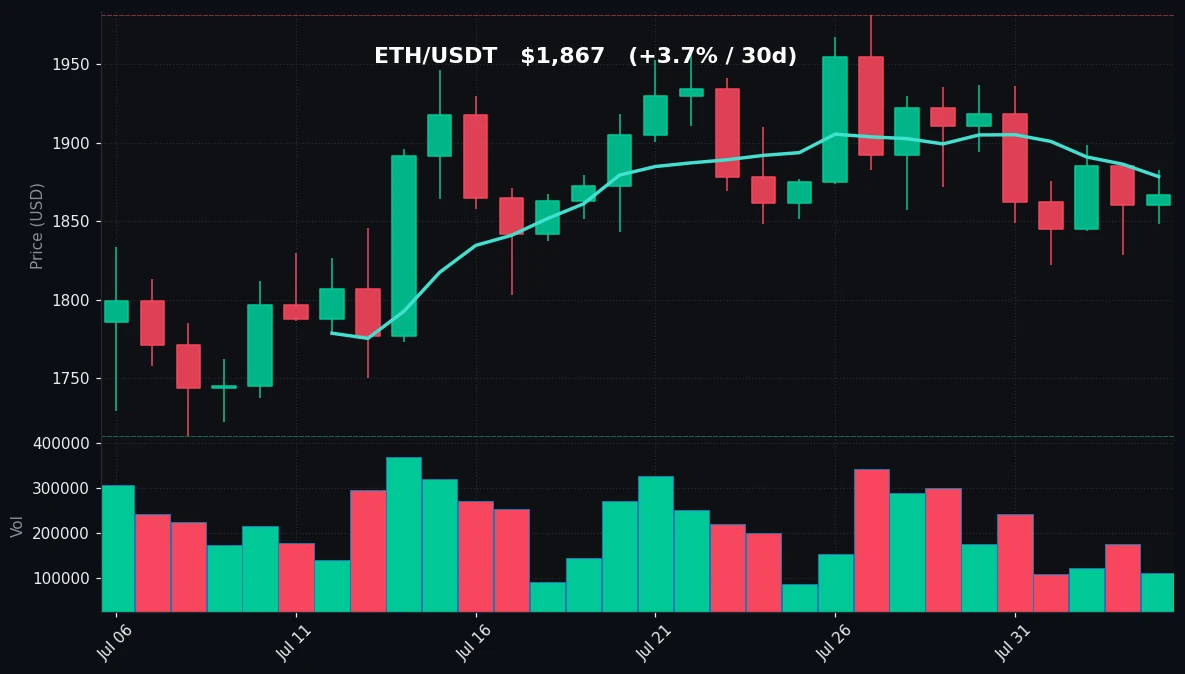
TradingView Live (4h)
Ethereum’s price action on August 4, 2026, shows a slightly weaker short-term profile compared to Bitcoin. ETH is trading at $1,867, up +0.33% on the day, but the 7-day performance of -2.89% indicates that sellers have had the upper hand recently. The 24-hour range was $1,848 to $1,882, a narrow band of 1.8% volatility.
The 7-day range for ETH is $1,822 to $1,937, while the 30-day range is $1,713 to $1,981. Notably, ETH’s 30-day performance is +3.73%, showing that despite the recent pullback, the asset has recovered from its lows near $1,713. This suggests that the medium-term trend is still constructive, but the short-term momentum has stalled.
Technically, ETH is trading below its MA7 of $1,878 but above the MA30 of $1,859. This crossover pattern—price below short-term MA but above long-term MA—often indicates a pullback within a larger uptrend. The MA30 is providing dynamic support, and the price has held above it for the past several days.
The RSI for ETH is 42.6, which is in neutral territory but on the lower end. This is higher than BTC’s RSI, indicating that ETH has not been sold off as aggressively on a relative basis. However, the 7-day decline of -2.89% is more pronounced than BTC’s -0.07%, suggesting that ETH is experiencing a sharper correction within its own cycle.
Volume for ETH is also subdued at 0.55x the 7-day average. This is consistent with the broader market slowdown. Low volume during a pullback can sometimes signal that the selling is not conviction-driven, but rather a lack of buying interest. The risk is that a volume spike to the downside could accelerate the decline toward the 7-day low of $1,822.
Key support for ETH is at $1,848 (24h low) and $1,822 (7-day low). Below that, the psychological $1,800 level and the 30-day low of $1,713 become relevant. Resistance is at $1,882 (24h high), $1,937 (7-day high), and $1,981 (30-day high). The MA7 at $1,878 is immediate resistance that ETH needs to reclaim to shift momentum. The price structure suggests a consolidation between $1,822 and $1,937, with the MA30 acting as the pivot point.
Key Technical Levels
| Asset | Support | Resistance | RSI |
|---|---|---|---|
| BTC | $62,275 (7d low), $61,307 (30d low) | $64,244 (24h high), $65,410 (7d high) | 35.8 (approaching oversold) |
| ETH | $1,848 (24h low), $1,822 (7d low) | $1,882 (24h high), $1,937 (7d high) | 42.6 (neutral) |
BTC vs ETH Dynamic
The correlation between BTC and ETH remains high, as expected in the crypto market, but the recent price action reveals some divergence in relative strength. Over the past 7 days, BTC has been essentially flat (-0.07%), while ETH has declined -2.89%. This suggests that during the recent pullback, ETH has been sold off more aggressively than BTC. However, over the 30-day horizon, ETH is up +3.73% while BTC is down -0.27%, indicating that ETH has been the stronger performer in the medium term.
This pattern—BTC holding up better in the short term but ETH outperforming over the longer window—is characteristic of a market where traders are rotating between the two assets based on momentum signals. The RSI differential (BTC at 35.8 vs ETH at 42.6) also suggests that BTC is closer to an oversold condition, which could lead to a short-term bounce in BTC, potentially dragging ETH higher. Conversely, if BTC breaks below its 7-day low, ETH could face accelerated selling given its weaker short-term momentum. The overall correlation remains positive, but the magnitude of moves differs, creating opportunities for relative-value strategies.
Strategy Fit
The current market conditions—low volatility, reduced volume, and neutral-to-oversold RSI levels—favor range-bound trading strategies over directional bets. For BTC, the price is sandwiched between $62,275 and $65,410, a range of approximately 5%. ETH is similarly contained between $1,822 and $1,937, a range of about 6.3%. These are ideal conditions for grid trading strategies.
A grid bot (available on Pionex as a built-in tool) can automatically place buy and sell orders at predetermined intervals within these ranges, profiting from the oscillations without requiring a directional view. Given the reduced volume, the grid spacing should be set wider to account for potential slippage and to avoid overtrading in a thin market.
For traders with a longer horizon, a DCA (Dollar-Cost Averaging) strategy may be appropriate, especially for ETH, which has a positive 30-day trend but is currently pulling back. Accumulating in tranches near the support levels of $1,822–$1,848 could build a position at a favorable average price. For BTC, DCA near the $62,275–$63,000 zone makes sense given the RSI approaching oversold.
A trend-following strategy is not recommended today, as neither asset is exhibiting a clear directional trend. The flat moving averages and declining volume indicate a lack of momentum. Traders who prefer trend strategies should wait for a breakout above the 7-day highs (BTC: $65,410, ETH: $1,937) or a breakdown below the 7-day lows before committing capital. Pionex’s trend bots can be configured to enter on such breakouts, but the current setup does not justify activation.
The most prudent approach is a combination of grid trading for the short-term range and DCA for medium-term accumulation, with strict stop-losses below the key support levels. The low volume environment demands caution, as any significant news event could trigger a sharp move that breaks the established ranges.
Risk Disclaimer
This market recap is for informational and educational purposes only and does not constitute financial advice, investment advice, trading advice, or any other form of advice. Cryptocurrency markets are highly volatile and involve substantial risk of loss. Past performance is not indicative of future results. The data presented herein is based on the specific date of 2026-08-04 and may not reflect current market conditions. You should conduct your own research and consult with a qualified financial advisor before making any investment decisions. The author and publisher of this document are not responsible for any financial losses incurred as a result of acting on the information provided. Trading cryptocurrencies may not be suitable for all investors. Never invest money that you cannot afford to lose.
FAQ
Is Bitcoin in an oversold condition right now?
Bitcoin’s RSI (14) is at 35.8, which is below the neutral 50 level and approaching the oversold threshold of 30. While this indicates that selling pressure has been dominant over the past two weeks, the price has not declined significantly, which suggests that buyers are absorbing the selling. An RSI below 30 would confirm an oversold condition, but at 35.8, it is more accurate to say that BTC is in a weak or bearish momentum phase rather than fully oversold.
Why is Ethereum down more than Bitcoin over the past 7 days?
Over the past week, ETH has declined -2.89% while BTC has been nearly flat at -0.07%. This divergence can be attributed to a few factors: ETH had a stronger 30-day run (+3.73%) compared to BTC (-0.27%), so a pullback in ETH may be a natural correction after outperforming. Additionally, lower trading volume in ETH relative to its 7-day average (0.55x) can amplify price moves in either direction. The RSI for ETH (42.6) is higher than BTC’s, suggesting that the selling pressure has not been as intense on a relative basis.
What are the most important support and resistance levels to watch?
For BTC, the immediate support is at $62,275 (7-day low), with a secondary support at $61,307 (30-day low). Resistance is at $64,244 (24-hour high) and $65,410 (7-day high). For ETH, support is at $1,848 (24-hour low) and $1,822 (7-day low), with resistance at $1,882 (24-hour high) and $1,937 (7-day high). These levels are critical because a break beyond them could signal a new trend direction, especially given the current low-volume environment.
Is the low trading volume a reason for concern?
Yes, low volume is a double-edged sword. On one hand, it means that the current price levels are not being heavily contested, which can lead to a stable, range-bound market. On the other hand, low volume reduces liquidity, meaning that a large order could cause significant price slippage. Historically, periods of very low volume often precede increased volatility, as a buildup of orders is released. Traders should be prepared for potential sharp moves once volume returns to normal levels.
What trading strategies are best suited for the current market conditions?
Given the narrow trading ranges and low volatility, grid trading strategies are best suited for the current environment. A grid bot can profit from the oscillations between support and resistance levels without needing to predict direction. For longer-term investors, a DCA strategy can be effective, especially for accumulating ETH near its support levels. Trend-following strategies are not recommended until a clear breakout or breakdown occurs. The Pionex platform offers built-in grid and DCA bots that can automate these strategies.


