BTC ETH Daily Recap — 2026-08-17

BTC ETH Daily Recap — 2026-08-17
Today at a Glance
Bitcoin (BTC) and Ethereum (ETH) both posted modest gains over the past 24 hours, with BTC climbing +1.19% to $63,648 and ETH advancing +1.47% to $1,904. BTC traded within a narrow $1,049 range, hitting an intraday high of $63,800 and a low of $62,751. Despite the positive daily move, BTC remains slightly negative on both the 7-day (-0.50%) and 30-day (-1.66%) timeframes, suggesting a continued consolidation phase below its 30-day high of $66,956. ETH, by contrast, is green across all major periods, with 7-day and 30-day gains of +1.62% and +1.68%, respectively. Volume for both assets is below their 7-day averages (BTC at 0.72x, ETH at 0.82x), indicating reduced participation. RSI readings are neutral for BTC (51.3) and approaching overbought territory for ETH (62.9). The market appears to be in a waiting pattern, with BTC stabilizing above its 7-day moving average while ETH pushes toward its recent range highs.
Bitcoin Analysis
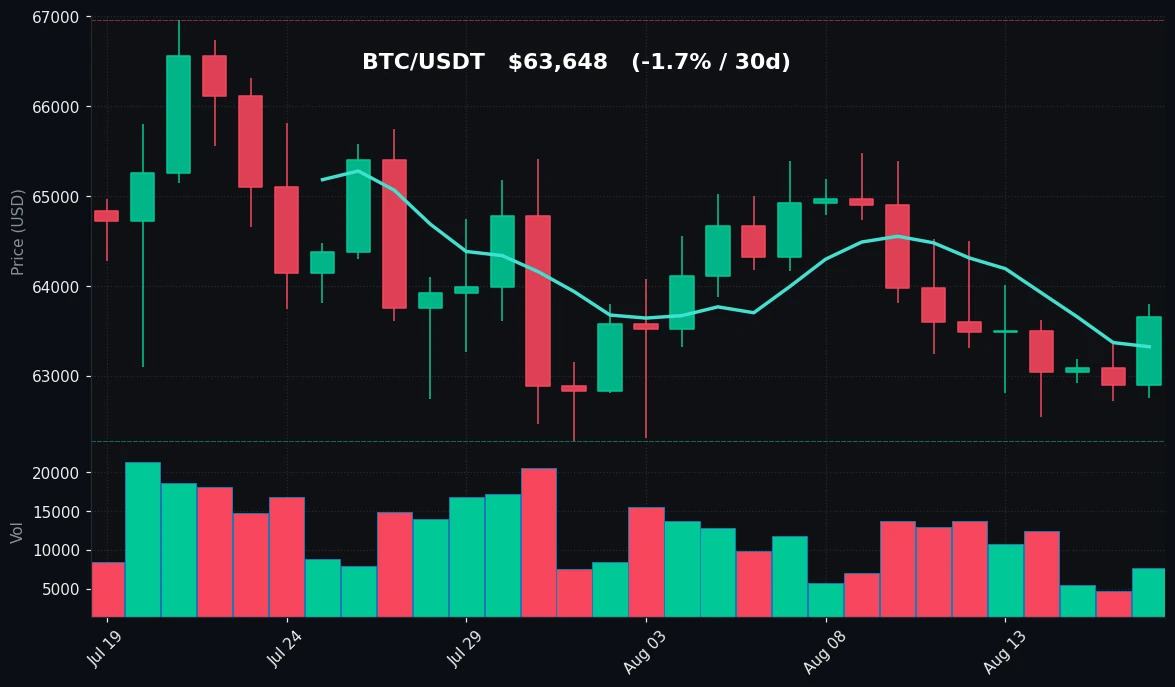
TradingView Live (4h)
Bitcoin is currently trading at $63,648, having established a 24-hour range between $62,751 and $63,800. The daily gain of +1.19% reflects a recovery from the lower end of its recent 30-day range, which spans from $62,275 to $66,956. Notably, BTC's 7-day high of $64,515 remains unchallenged, and the asset is still $1,308 below its 30-day peak. This suggests that while buyers are defending the downside, momentum has not yet been sufficient to reclaim higher levels.
From a technical perspective, BTC is trading above its 7-day moving average of $63,321 but remains below its 30-day moving average of $64,200. This positioning indicates a short-term bullish tilt within a longer-term neutral-to-weak structure. The gap between the two moving averages is relatively narrow at roughly $879, which often precedes a volatility expansion. The 30-day moving average is acting as immediate overhead resistance, and a sustained break above this level would be required to shift the medium-term bias.
The Relative Strength Index (RSI) for BTC sits at 51.3, which is squarely in neutral territory. This reading implies that neither buyers nor sellers have a decisive edge at the current price level. RSI values between 45 and 55 typically reflect a balanced market, and BTC's current reading aligns with the observed price consolidation. There is ample room in either direction before RSI would signal overbought (above 70) or oversold (below 30) conditions.
Volume analysis reveals that BTC's trading volume over the past 24 hours is only 0.72 times its 7-day average. This below-average participation is a key observation. Low-volume advances are generally considered less reliable than those accompanied by elevated activity. The current price increase, while positive, has not been supported by a surge in market interest, which may explain the lack of follow-through beyond the $63,800 level.
BTC has established a clear near-term support zone around $62,535–$62,751, which corresponds to the 7-day low and the 24-hour low, respectively. The 30-day low at $62,275 provides a secondary support level. On the upside, resistance is visible at $64,200 (30-day MA), followed by $64,515 (7-day high) and $66,956 (30-day high). The price action over the past week has been characterized by lower highs and higher lows, forming a symmetrical triangle pattern that typically precedes a directional breakout. However, with volume declining, the resolution of this pattern may be delayed.
Ethereum Analysis
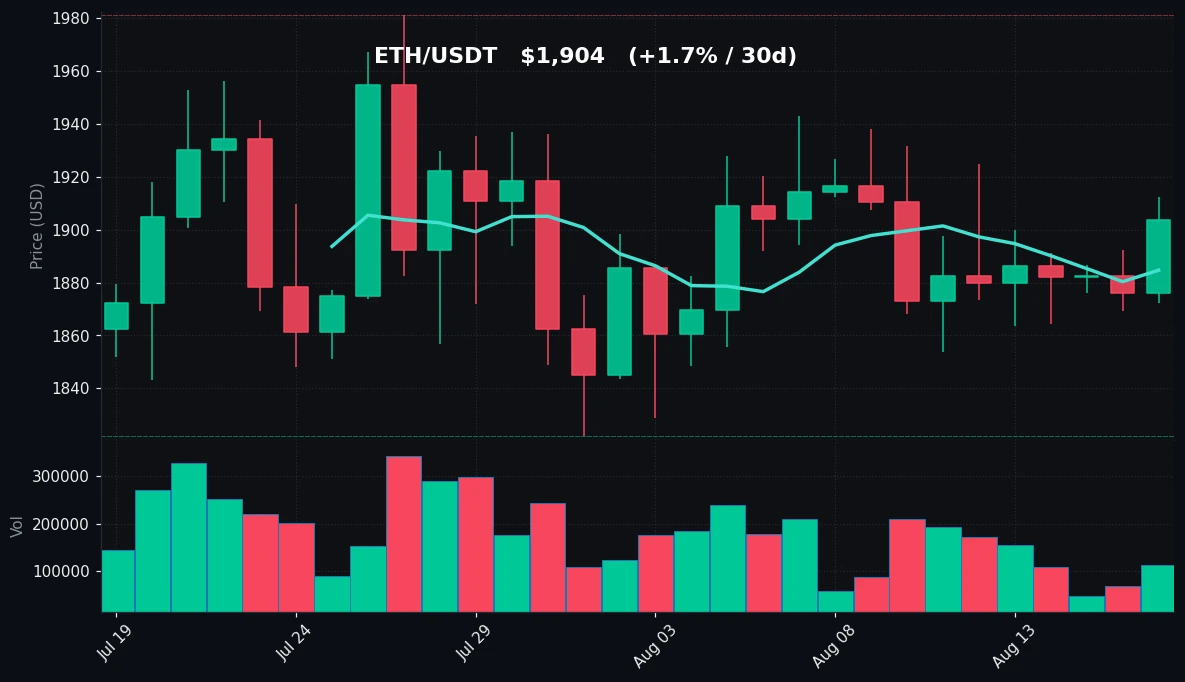
TradingView Live (4h)
Ethereum is trading at $1,904, up +1.47% over the past 24 hours, with an intraday range of $1,872 to $1,913. ETH's performance is notably stronger than BTC's across all relevant timeframes. The 7-day gain of +1.62% and 30-day gain of +1.68% indicate that ETH has been in a gradual uptrend, even as BTC has struggled to maintain positive momentum. ETH's 30-day range spans from $1,822 to $1,981, and the current price sits roughly in the upper third of that range.
Technically, ETH is trading above both its 7-day moving average of $1,885 and its 30-day moving average of $1,893. This is a bullish alignment, with short-term momentum confirmed by the price being above both averages. The 7-day MA has recently crossed above the 30-day MA, a pattern that often signals the beginning of a sustained upward move. However, the gap between the two averages is modest at only $8, suggesting that the trend is still in its early stages.
The RSI for ETH is reading 62.9, which is approaching overbought territory (typically defined as 70 or above). This elevated reading indicates that buying pressure has been consistent and that ETH has seen stronger momentum than BTC in the current session. While an RSI above 60 does not necessarily precede an immediate pullback, it does suggest that the pace of appreciation may slow as the asset approaches overbought conditions.
Volume for ETH is at 0.82 times its 7-day average, which is slightly better than BTC's volume ratio but still below par. The moderate volume accompanying ETH's price increase suggests that the move is being driven by genuine, albeit not exuberant, buying interest. This is a healthier sign than a price increase on very low volume.
Key resistance for ETH is located at $1,925 (7-day high) and then $1,981 (30-day high). A break above the $1,925 level would place ETH in a position to challenge its 30-day peak. On the downside, support is established at $1,872 (24-hour low), $1,854 (7-day low), and $1,822 (30-day low). The 30-day moving average at $1,893 now acts as dynamic support, and as long as ETH holds above this level, the short-term structure remains constructive. ETH's relative strength compared to BTC is a noteworthy development, as it suggests capital rotation within the crypto market favoring the second-largest asset by market capitalization.
Key Technical Levels
| Asset | Support | Resistance | RSI |
|---|---|---|---|
| BTC | $62,535 | $64,200 | Neutral (51.3) |
| ETH | $1,872 | $1,925 | Approaching overbought (62.9) |
BTC vs ETH Dynamic
The relationship between BTC and ETH over the past 24 hours shows a moderate positive correlation, though ETH is outperforming BTC by roughly 0.28 percentage points on the daily timeframe. This divergence is part of a broader trend observed over the past week, where ETH has gained +1.62% while BTC has declined -0.50%. The 30-day data reinforces this pattern, with ETH up +1.68% versus BTC down -1.66%. This relative strength suggests that market participants are currently favoring ETH over BTC, possibly due to different sector-specific catalysts or a rotation of capital from the largest cryptocurrency into alternative assets. The correlation between the two remains positive — both are moving in the same direction today — but the magnitude of ETH's moves is larger relative to its price base. Historically, periods where ETH outperforms BTC for extended durations often coincide with increased risk appetite in the broader crypto market. However, the current volume profile for both assets is below average, indicating that this rotation is happening on relatively thin participation. Traders monitoring the pair may note that ETH's RSI is significantly higher than BTC's, suggesting that ETH has absorbed more buying pressure in the current cycle.
Strategy Fit
Given the current market structure, the most suitable trading strategies differ for BTC and ETH based on their respective volatility profiles and technical positions. BTC's RSI of 51.3 and its position between the 7-day and 30-day moving averages indicate a ranging market with no clear directional bias. The below-average volume (0.72x) further suggests that trend-following strategies may generate false signals in the current environment. For BTC, a grid trading strategy is well-suited to this type of consolidation. Grid bots, such as those available on Pionex, automatically place buy and sell orders at predetermined intervals around a base price, profiting from the natural oscillations of a ranging asset. BTC's current range of approximately $62,275 to $64,515 over the past week provides a defined band within which a grid bot can operate effectively. The neutral RSI supports the thesis that price is likely to continue oscillating rather than breaking out decisively.
For ETH, the situation is slightly different. With an RSI of 62.9 and price above both moving averages, ETH is exhibiting a mild uptrend. However, the approach toward overbought conditions suggests that chasing price at current levels carries elevated risk of a short-term pullback. A DCA (Dollar-Cost Averaging) strategy may be more appropriate for ETH in this context. DCA involves investing a fixed amount at regular intervals, which smooths out entry prices over time. Pionex offers automated DCA bots that can execute this strategy without manual intervention. For traders with a higher risk tolerance, a trend-following strategy on ETH could be considered if price breaks above the $1,925 resistance level with accompanying volume expansion. However, given that ETH's volume is currently below its 7-day average, waiting for confirmation is prudent. The differing conditions of BTC (range-bound) and ETH (mild uptrend) suggest that a diversified approach using both grid and DCA bots may be optimal in the current market environment.
Risk Disclaimer
The content provided in this market recap is for informational and educational purposes only and does not constitute financial advice, investment advice, or a recommendation to buy or sell any digital assets. Cryptocurrency markets are highly volatile and involve substantial risk of loss. Past performance is not indicative of future results. The data presented herein is based on publicly available information and is believed to be accurate at the time of writing, but no guarantee is made regarding its completeness or accuracy. You should conduct your own research and consult with a qualified financial advisor before making any investment decisions. Trading strategies, including but not limited to grid trading, DCA, and trend-following, may result in significant losses, particularly in adverse market conditions. Never invest more than you can afford to lose. The use of automated trading tools, such as those offered by Pionex, does not eliminate the risk of loss and may amplify losses in certain market scenarios. You are solely responsible for your investment decisions and the management of your portfolio.
FAQ
What is the current price of Bitcoin (BTC)?
Bitcoin is currently trading at $63,648 as of 2026-08-17. This represents a +1.19% increase over the past 24 hours. The intraday range has been between $62,751 (low) and $63,800 (high). Over the past 7 days, BTC has declined by -0.50%, and over the past 30 days, it has declined by -1.66%. BTC's 7-day high stands at $64,515, while its 7-day low is $62,535. The 30-day high and low are $66,956 and $62,275, respectively.
What is the current price of Ethereum (ETH)?
Ethereum is trading at $1,904 as of 2026-08-17, up +1.47% over the past 24 hours. The intraday range has been $1,872 to $1,913. ETH has posted positive returns across all major timeframes: +1.62% over 7 days and +1.68% over 30 days. The 7-day high is $1,925 and the 7-day low is $1,854. The 30-day high is $1,981 and the 30-day low is $1,822.
What do the RSI values indicate for BTC and ETH?
BTC's RSI (Relative Strength Index) is currently at 51.3, which is considered neutral. This reading suggests that the market is balanced between buying and selling pressure, with no clear directional bias. ETH's RSI is at 62.9, which is approaching overbought territory (typically 70 or above). This indicates that ETH has experienced stronger upward momentum than BTC and may be at higher risk of a short-term pullback if buying pressure subsides.
How do the moving averages compare for BTC and ETH?
BTC is trading at $63,648, which is above its 7-day moving average of $63,321 but below its 30-day moving average of $64,200. This positioning suggests short-term strength within a longer-term consolidation. ETH is trading at $1,904, above both its 7-day moving average of $1,885 and its 30-day moving average of $1,893. This is a bullish alignment, with the 7-day MA having recently crossed above the 30-day MA.
What trading strategies might be suitable given current market conditions?
For BTC, which is exhibiting range-bound behavior with neutral RSI and below-average volume, a grid trading strategy may be appropriate. Grid bots, such as those available on Pionex, can profit from price oscillations within a defined range. For ETH, which is in a mild uptrend but approaching overbought conditions, a DCA (Dollar-Cost Averaging) strategy may be more suitable to smooth out entry prices over time. Traders should note that these are general observations based on technical indicators and do not constitute personalized investment advice.


