BTC ETH Daily Recap — 2026-08-19

BTC ETH Daily Recap — 2026-08-19
Today at a Glance
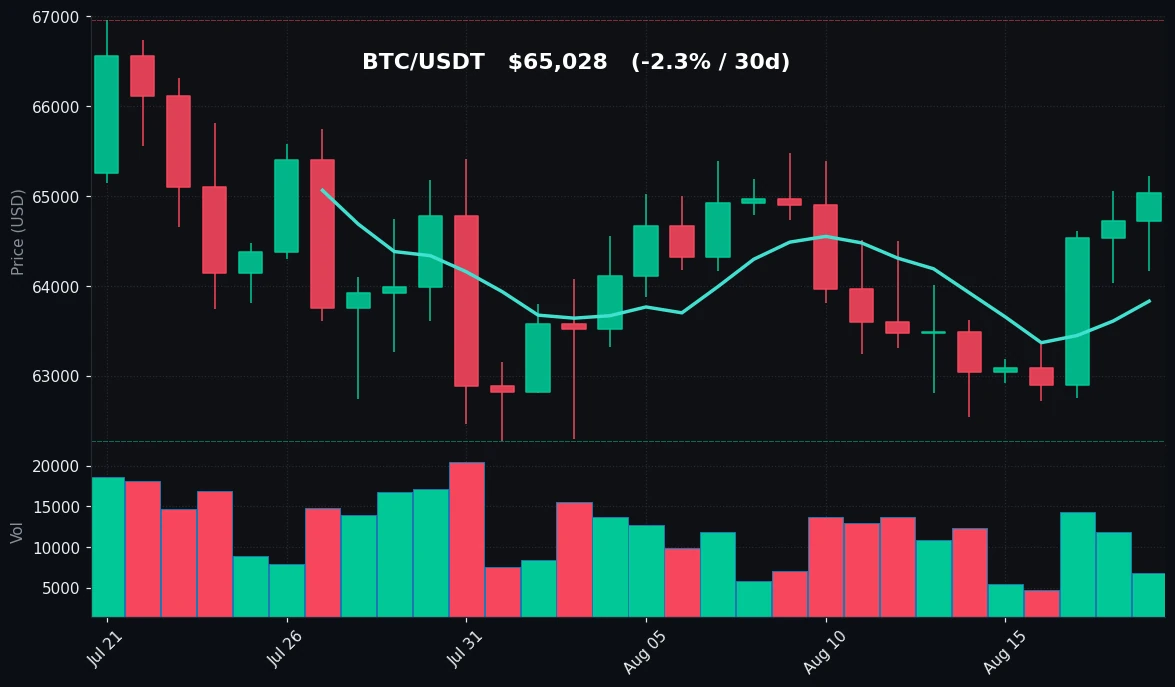
Bitcoin (BTC) traded in a tight range on 2026-08-19, closing near $65,028 with a modest 24-hour gain of +0.47%. The intraday high reached $65,218, while the low touched $64,166, indicating a relatively narrow $1,052 range. Over the past week, BTC advanced +2.44%, recovering from a 7-day low of $62,535. However, on a 30-day basis, BTC remains down -2.30%, suggesting the broader trend is still consolidative rather than decisively bullish.
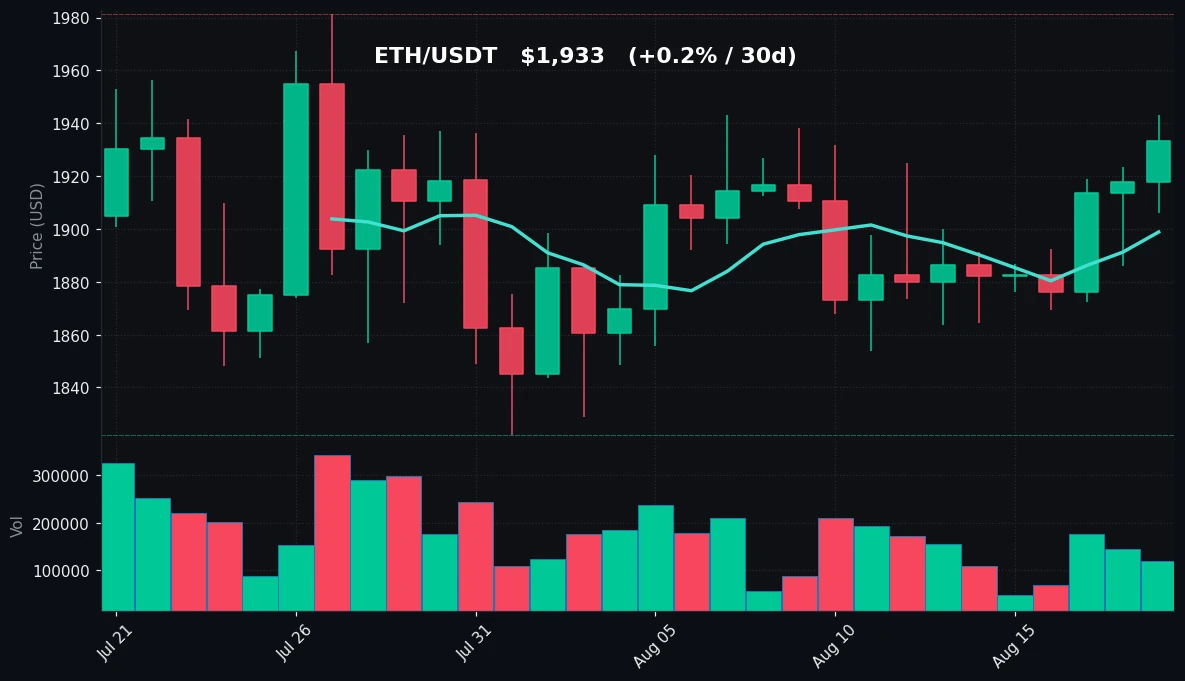
Ethereum (ETH) showed slightly stronger momentum, gaining +0.81% on the day to $1,933. Its 7-day performance of +2.84% outpaced BTC, and ETH is nearly flat over 30 days (+0.17%). ETH's intraday range was tighter ($1,906–$1,943), and its RSI at 58.2 sits above BTC's 53.4, indicating slightly more bullish short-term pressure. Volume for both assets remains below their 7-day averages—BTC at 0.65x and ETH at 0.95x—suggesting a low-participation session with no decisive breakout.
Bitcoin Analysis
TradingView Live (4h)
Bitcoin is currently trading at $65,028, comfortably above its 7-day moving average of $63,829 and its 30-day moving average of $64,222. This positioning above both MAs indicates a short-term bullish tilt, though the gap between price and MA30 is only about 1.25%, reflecting a market that is not overextended.
The 7-day price action shows a clear recovery from the $62,535 low. BTC has printed higher lows over the past week, with the most recent swing low at $64,166 (today's low) holding above the prior day's levels. The 7-day high of $65,218 was tested today and rejected, leaving a minor resistance zone just above current prices.
The RSI(14) at 53.4 sits in neutral territory, neither overbought nor oversold. This reading suggests there is room for upward movement without immediate momentum exhaustion, but also no strong buying pressure driving a breakout. The RSI has been oscillating in the 50–60 range for the past several sessions, consistent with a range-bound market.
Volume is notably light—only 0.65x the 7-day average. This is a critical observation. The recent price recovery from $62,535 to $65,218 has occurred on declining volume, which weakens the conviction behind the move. A lack of volume often precedes either a consolidation or a reversal, as there is insufficient participation to sustain directional momentum.
Key technical levels to monitor: immediate support sits at $64,166 (today's low) and the 7-day moving average at $63,829. Below that, the $62,535 area represents the recent swing low. On the upside, $65,218 (today's high) is the first resistance, followed by the 30-day high of $66,956. The MA30 at $64,222 has been acting as dynamic support, and today's close above it is a positive signal, but the failure to hold above $65,200 suggests sellers are active near that level.
The 30-day range ($62,275–$66,956) is roughly $4,681 wide, and BTC is currently positioned in the upper third of that range. This suggests that while the medium-term trend is still bearish (price below the 30-day high), the short-term momentum is constructive. However, given the low volume environment, traders should be cautious about interpreting the recent gains as a definitive trend reversal.
Ethereum Analysis
TradingView Live (4h)
Ethereum is trading at $1,933, up +0.81% on the day. The asset is above both its 7-day MA ($1,899) and 30-day MA ($1,896), with the two averages nearly converged—a sign that the market has been consolidating tightly over the past month. The 30-day price range is $1,822–$1,981, a span of $159, which is relatively narrow for ETH and indicates a low-volatility environment.
The 7-day performance of +2.84% is stronger than BTC's +2.44%, and ETH has reclaimed the $1,900 psychological level after dipping to $1,864 earlier in the week. Today's high of $1,943 is also the 7-day high, suggesting that ETH is making incremental progress rather than experiencing a sharp spike. The 30-day high of $1,981 remains untested, leaving about 2.5% upside to that level.
RSI(14) at 58.2 is in bullish territory (above 50) but not overbought (below 70). This indicates moderate buying momentum that has room to continue before becoming stretched. Compared to BTC, ETH's RSI is higher, which aligns with its stronger relative performance over the past week.
Volume at 0.95x the 7-day average is nearly at par, which is healthier than BTC's volume profile. This suggests that ETH's price action is being supported by more active participation, though still not at elevated levels. The fact that ETH is trading near its 7-day high on near-average volume provides more confidence in the current move compared to BTC.
Key support levels: $1,899 (7-day MA), $1,896 (30-day MA), and $1,864 (recent swing low). The convergence of the two moving averages around $1,895–$1,899 creates a solid support cluster. A break below this zone would likely trigger a test of $1,822 (30-day low). On the upside, $1,943 (today's high) is the immediate resistance, followed by $1,981 (30-day high).
ETH's 30-day performance of +0.17% suggests that the asset has been range-bound for a month, with no clear directional bias. However, the recent push above the MA cluster and the higher RSI reading indicate that buyers are gradually gaining control. The key question for ETH is whether it can sustain a move above $1,943 and challenge the $1,981 level, or if it will fade back into the $1,890–$1,920 range that has dominated recent trading.
Key Technical Levels
| Asset | Support | Resistance | RSI |
|---|---|---|---|
| BTC | $63,829 (MA7) / $62,535 | $65,218 / $66,956 | 53.4 — Neutral |
| ETH | $1,899 (MA7) / $1,864 | $1,943 / $1,981 | 58.2 — Neutral-to-Bullish |
BTC vs ETH Dynamic
The correlation between BTC and ETH remains strong over the past week, with both assets posting gains of approximately +2.4% to +2.8%. However, ETH has outperformed BTC by roughly 40 basis points over the 7-day period, and its RSI is nearly 5 points higher. This suggests that ETH is exhibiting slightly more relative strength, which could indicate a rotation of capital from BTC into ETH, or simply that ETH's lower volatility profile is attracting more balanced buying.
The 30-day performance diverges more notably: BTC is down -2.30% while ETH is nearly flat (+0.17%). This divergence is significant because it shows that ETH has held up better during the recent pullback, which may reflect different market participants or different fundamental drivers. BTC's higher volatility (as evidenced by its wider 30-day range relative to its price) makes it more sensitive to macro headwinds, while ETH's tighter range suggests a more stable bid.
The current price ratio (ETH/BTC) is approximately 0.0297, which is within the recent historical range. There is no evidence of a major regime shift in the ETH/BTC relationship, but the short-term data favors ETH's relative performance.
Strategy Fit
The current market conditions—low volume, neutral RSI readings, and tight trading ranges—are characteristic of a consolidation phase. For BTC, the 0.65x volume ratio is particularly telling: the market is not generating enough participation to sustain a breakout or breakdown. This environment is generally unfavorable for trend-following strategies that rely on momentum.
A grid trading strategy appears well-suited to the current conditions. With BTC trading in a $62,535–$65,218 range over the past week and ETH in a $1,864–$1,943 range, a grid bot can profit from the oscillation without needing to predict direction. The key advantage of grid trading in this environment is that it capitalizes on mean reversion, which is the dominant behavior when volume is low and RSI is neutral.
For traders using Pionex's built-in bots, the Grid Trading bot is the most appropriate choice today. The range parameters should be set based on the recent swing levels identified above. For BTC, a grid between $63,500 and $65,500 would capture the current volatility while leaving room for slight expansion. For ETH, a grid between $1,880 and $1,950 aligns with the established range.
DCA (Dollar-Cost Averaging) strategies are less optimal in a sideways market because they assume a long-term upward bias. While DCA remains viable for long-term holders, the current low-volatility environment means that entries will not be significantly better than average, reducing the strategy's edge.
Trend-following strategies should be avoided until a clear breakout occurs. The lack of volume and the proximity of price to both support and resistance levels make it risky to assume directional momentum. A conservative approach would be to wait for a daily close above $65,218 (BTC) or $1,943 (ETH) on above-average volume before considering trend-based entries.
Risk Disclaimer
This market recap is provided for informational and educational purposes only and does not constitute financial advice, investment advice, trading advice, or any other sort of advice. Cryptocurrency markets are highly volatile and involve substantial risk of loss. Past performance is not indicative of future results. You should not treat any opinion expressed in this recap as a specific inducement to make any particular investment or follow any particular strategy. Always conduct your own research and consult with a qualified financial advisor before making any investment decisions. The data presented here is based on historical information as of 2026-08-19 and may not reflect current market conditions. The author and publisher of this recap hold no responsibility for any financial losses incurred as a result of acting on the information provided.
FAQ
Q1: Why is BTC volume significantly below its 7-day average (0.65x)?
A1: The 0.65x volume ratio indicates that today's trading activity is only 65% of the average daily volume over the past week. This typically occurs during periods of low market participation, such as weekends, holidays, or when major macro events are pending. Low volume often leads to tighter ranges and can precede a volatility expansion once participation returns.
Q2: What does an RSI of 53.4 for BTC indicate?
A2: An RSI of 53.4 is in neutral territory, meaning neither buyers nor sellers are in control. It reflects a market that has recovered from oversold conditions but has not yet reached overbought levels (typically 70+). This reading allows for movement in either direction without the constraint of momentum exhaustion.
Q3: How significant is ETH trading above both its MA7 and MA30?
A3: When price is above both moving averages, it indicates that the short-term and medium-term trends are bullish. However, the close proximity of ETH's MAs ($1,899 and $1,896) suggests that the market has been consolidating tightly. The signal is only meaningful if ETH can maintain this position on increasing volume.
Q4: What is the practical difference between support and resistance levels in this context?
A4: Support is a price level where buying interest is expected to be strong enough to prevent further decline, while resistance is a level where selling interest is expected to halt upward movement. In the current data, BTC's support at $62,535 was tested and held over the past week, while resistance at $65,218 was tested today and rejected. These levels are derived from recent price history.
Q5: Why is the BTC vs ETH correlation important for portfolio management?
A5: High correlation means that holding both assets provides limited diversification benefit, as they tend to move in the same direction. The current data shows that while both assets are positively correlated, ETH's stronger relative performance and lower volatility may offer a slightly different risk profile. However, in a highly correlated market, the primary diversification comes from holding non-crypto assets.


