BTC ETH Daily Recap — 2026-08-20

BTC ETH Daily Recap — 2026-08-20
Today at a Glance
Bitcoin (BTC) surged 3.47% over the past 24 hours to close at $71,742, pushing its weekly gain to 13.00% and its 30-day advance to 8.51%. The intraday range was wide, with a low of $68,902 and a high of $72,490 — the latter representing the highest level in both the 7-day and 30-day windows. Trading volume has nearly doubled relative to the 7-day average (1.94x), indicating strong participation behind the move. Ethereum (ETH) also posted gains, rising 1.23% on the day to $2,280, with a 24-hour range of $2,222 to $2,320. Over the past week, ETH has outperformed BTC substantially, gaining 20.90%, and is up 17.90% over the last 30 days. ETH’s volume also expanded to 1.84x its 7-day average. Both assets are trading well above their 7-day and 30-day moving averages, though their RSI readings — 81.8 for BTC and 88.4 for ETH — signal that the recent advance has been sharp and may be stretching short-term momentum.
Bitcoin Analysis
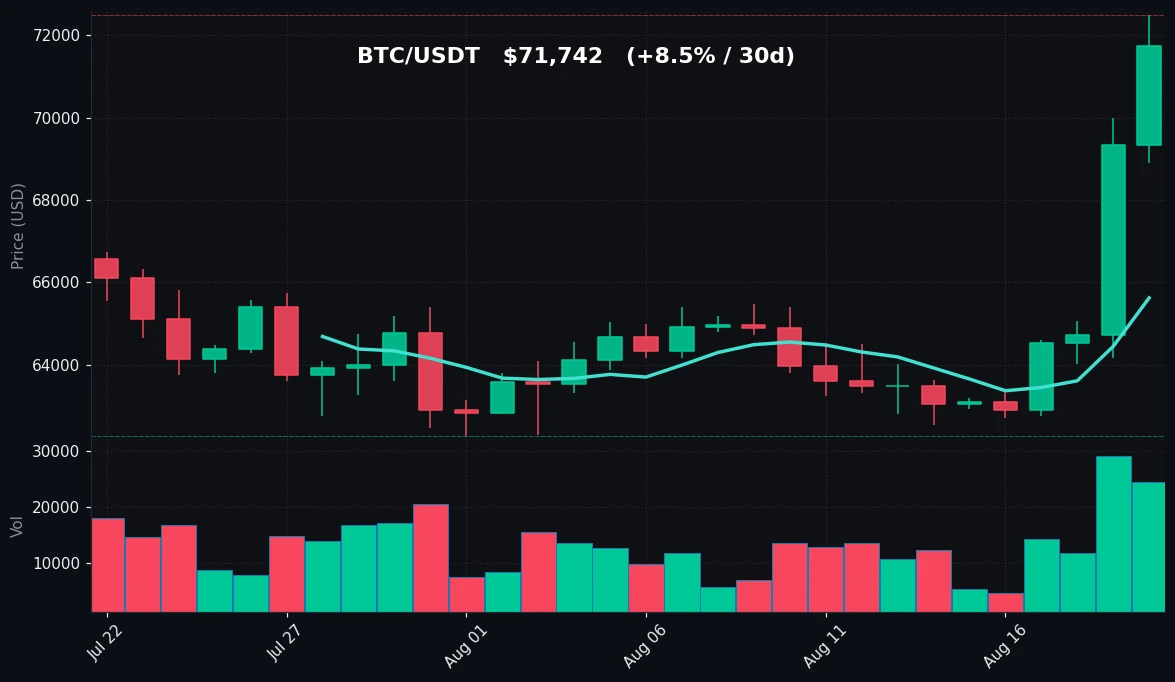
TradingView Live (4h)
Bitcoin’s price action over the past 24 hours confirms a continuation of the strong uptrend that began in late July. The asset climbed from an intraday low of $68,902 to a high of $72,490, closing at $71,742. This places BTC comfortably above both its 7-day moving average of $65,623 and its 30-day moving average of $64,538. The gap between price and the 30-day MA is approximately 11.2%, which reflects the velocity of the recent move. The 7-day range spans from $62,535 to $72,490, meaning the current price sits near the top of that range — a sign that buyers have maintained control throughout the week.
Volume analysis shows a notable expansion. The current 24-hour volume is 1.94 times the 7-day average, which suggests that the rally is being supported by genuine participation rather than thin liquidity. This is an important observation because volume confirmation adds credibility to price moves. However, the RSI(14) reading of 81.8 is a key technical signal. An RSI above 70 is traditionally considered overbought territory, and a reading above 80 indicates extreme overbought conditions. This does not necessarily imply an imminent reversal, but it does suggest that the pace of appreciation has been unusually rapid and that the market may be susceptible to sharp pullbacks if momentum stalls.
From a technical structure perspective, BTC has established a clear sequence of higher highs and higher lows over the past 30 days. The 30-day low of $62,275 and the 7-day low of $62,535 provide a solid support zone in the low $62,000s. The current price is approximately 15% above that level. The immediate resistance is the recent high of $72,490, which was tested and rejected intraday. A sustained close above this level would open new price discovery, but that remains a market outcome rather than a prediction. The data simply shows that BTC is in a strong uptrend with elevated momentum and above-average volume, while RSI signals that the move may be overextended in the short term.
Ethereum Analysis
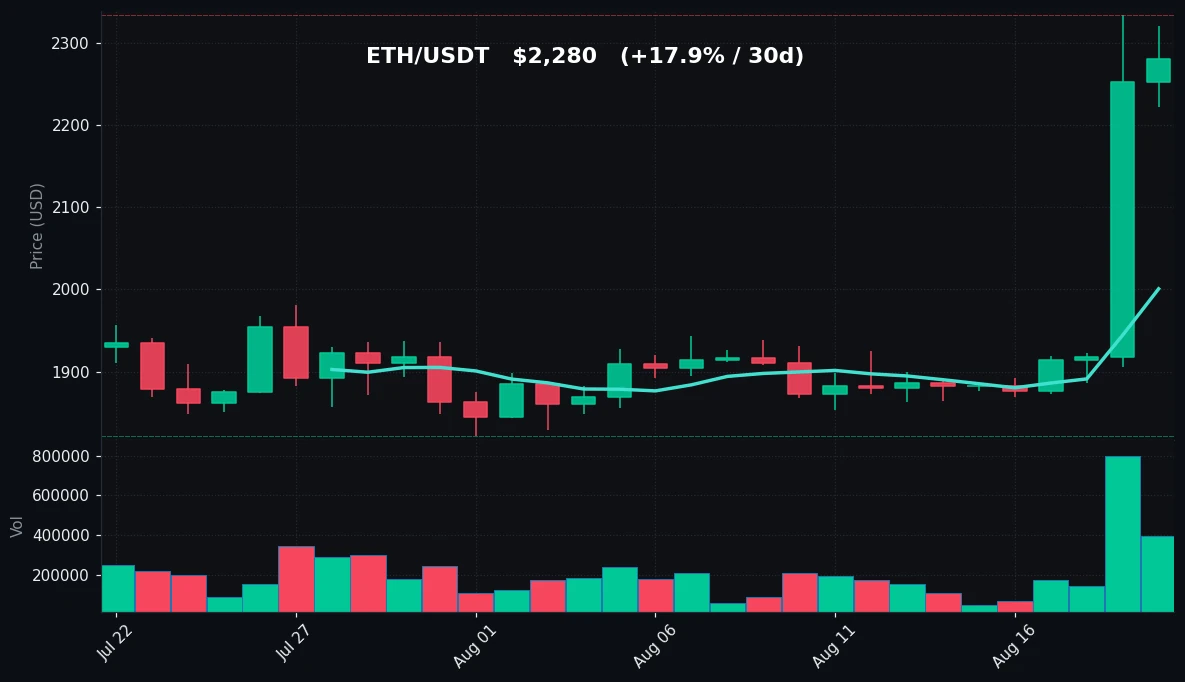
TradingView Live (4h)
Ethereum’s performance over the past 24 hours was positive but more muted relative to Bitcoin, with a gain of 1.23% to close at $2,280. The intraday range was $2,222 to $2,320, with the high falling just short of the 7-day high of $2,334. Over the past week, ETH has gained 20.90%, significantly outpacing BTC’s 13.00% weekly advance. This relative strength is notable and reflects a broader rotation into ETH or a catch-up trade after a period of underperformance. The 30-day gain of 17.90% further underscores the sustained nature of the move.
Technically, ETH is trading well above its 7-day moving average of $2,001 and its 30-day moving average of $1,918. The distance from the 30-day MA is approximately 18.9%, which is even wider than BTC’s deviation from its own 30-day MA. This indicates that ETH’s rally has been more aggressive on a percentage basis. The 7-day range of $1,864 to $2,334 shows that the asset has climbed roughly 25% from its weekly low, a substantial move within a short period.
Volume for ETH is also elevated at 1.84 times the 7-day average, confirming that the rally is accompanied by strong trading activity. However, the RSI(14) reading of 88.4 is extremely overbought — well above the 70 threshold and even above the 80 level that is often considered a red flag. This is a higher RSI reading than BTC’s 81.8, indicating that ETH’s momentum is even more stretched. The 30-day low of $1,822 and the 7-day low of $1,864 form a support zone in the mid-$1,800s. The immediate resistance is the recent high of $2,334. The data shows an asset in a powerful uptrend with strong volume, but with momentum indicators at levels that historically precede consolidation or corrective phases.
Key Technical Levels
| Asset | Support | Resistance | RSI |
|---|---|---|---|
| BTC | $68,902 (24h low) / $62,535 (7d low) | $72,490 (7d/30d high) | Overbought (81.8) |
| ETH | $2,222 (24h low) / $1,864 (7d low) | $2,334 (7d/30d high) | Overbought (88.4) |
BTC vs ETH Dynamic
The correlation between Bitcoin and Ethereum remains positive, as both assets advanced in tandem over the past 24 hours and over the past week. However, the magnitude of the moves differs notably. ETH’s 7-day gain of 20.90% is substantially higher than BTC’s 13.00%, indicating that ETH is currently the higher-beta asset. This is a common pattern in crypto markets: when BTC establishes a directional move, ETH often amplifies it, both on the upside and the downside. The RSI differential is also telling — ETH at 88.4 versus BTC at 81.8 — suggesting that ETH carries more short-term momentum risk. The volume dynamics are similar, with both assets seeing nearly double their average volume, though BTC’s 1.94x is slightly higher than ETH’s 1.84x. Overall, the two assets are moving in the same direction, but ETH is demonstrating greater volatility and sensitivity to market flows.
Strategy Fit
Given the current market conditions — strong uptrends, elevated volume, and RSI readings in overbought territory — the appropriate strategy depends on one’s risk tolerance and timeframe. For traders who favor trend-following, the current environment supports a momentum-based approach, as both BTC and ETH are trading above their key moving averages with volume confirmation. However, the extreme RSI levels suggest that entering at current prices carries the risk of buying near a short-term peak.
For those who prefer to manage volatility rather than chase momentum, a grid trading strategy may be well-suited. Grid bots, such as those available on Pionex, automatically place buy and sell orders within a predefined price range, capturing profits from price oscillations. In a market with wide intraday ranges — BTC’s 24-hour range was $3,588 and ETH’s was $98 — a grid bot can potentially benefit from the volatility without requiring directional calls. This approach is particularly relevant when RSI is overbought, as it allows participation in the market while mitigating the risk of a single-direction entry.
Dollar-cost averaging (DCA) remains a viable strategy for long-term accumulators. DCA bots on Pionex can be configured to buy at regular intervals or at price dips, smoothing out the entry price over time. In an overbought market, DCA reduces the risk of investing a lump sum at a local top. Trend-following strategies, such as trailing stop or moving average crossover bots, are also applicable, but they should be used with caution given the stretched momentum indicators. The key takeaway is that the current volatility is high, and strategies that embrace range-bound behavior or systematic accumulation may be more resilient than discretionary entries.
Risk Disclaimer
This market recap is provided for informational and educational purposes only. It does not constitute financial advice, investment advice, trading advice, or any other form of professional advice. Cryptocurrency markets are highly volatile and involve substantial risk of loss. Past performance is not indicative of future results. You should not make any investment decisions based solely on the information provided in this document. Always conduct your own research and consult with a qualified financial advisor before making any investment. The data presented herein is derived from publicly available sources and is believed to be accurate as of the date of publication, but no guarantee is made regarding its completeness or accuracy. Trading cryptocurrencies may not be suitable for all investors, and you should only trade with capital you can afford to lose.
FAQ
What does an RSI above 80 mean for BTC and ETH?
An RSI (Relative Strength Index) above 80 indicates that an asset is in extremely overbought territory. For BTC, the RSI is 81.8, and for ETH, it is 88.4. This suggests that the recent price increases have been rapid and that the asset may be due for a pullback or consolidation. However, RSI can remain in overbought territory for extended periods during strong trends, so it is not a definitive sell signal.
Why is ETH outperforming BTC this week?
ETH gained 20.90% over the past 7 days, while BTC gained 13.00%. This relative outperformance may be due to a catch-up trade, as ETH had lagged BTC in prior weeks, or it could reflect specific catalysts within the Ethereum ecosystem. Higher volatility in ETH is also a factor, as it tends to amplify BTC’s moves in both directions.
What is the significance of the volume being nearly double the average?
Volume at 1.94x (BTC) and 1.84x (ETH) the 7-day average indicates that the price moves are supported by strong trading activity. High volume during a rally suggests broad participation and adds credibility to the trend. Conversely, low volume rallies are often viewed as weaker and more susceptible to reversal.
What are the key support and resistance levels to watch?
For BTC, immediate support is at the 24-hour low of $68,902, with stronger support at the 7-day low of $62,535. Resistance is at the recent high of $72,490. For ETH, support is at $2,222 (24h low) and $1,864 (7d low), with resistance at $2,334 (7d/30d high). These levels are derived from recent price action.
How can grid trading bots help in the current market?
Grid trading bots, such as those offered by Pionex, place a series of buy and sell orders at predetermined price intervals. In a volatile market like the current one, where BTC and ETH are experiencing wide intraday ranges, a grid bot can automatically capture profits from price fluctuations without requiring a directional view. This can be particularly useful when RSI is overbought, as it reduces the risk of a single-entry position.


