BTC ETH Daily Recap — 2026-08-21

BTC ETH Daily Recap — 2026-08-21
Today at a Glance
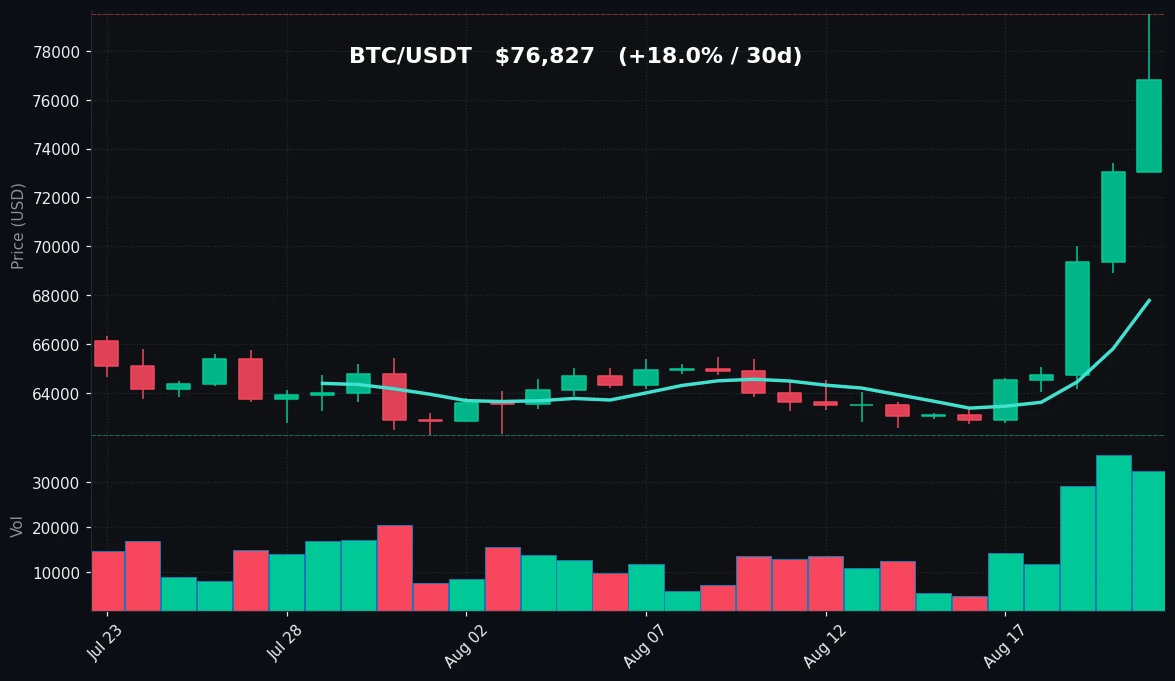
Bitcoin (BTC) surged 5.21% over the last 24 hours, trading at $76,827 after hitting a session high of $79,500 and a low of $73,027. The weekly gain stands at a robust +21.86%, with the 30-day return at +18.01%. BTC remains firmly above both its 7-day moving average ($67,776) and 30-day moving average ($64,938), with the 7-day high of $79,500 representing the upper bound of recent price discovery. Trading volume is at 2.0x the 7-day average, indicating strong participation.
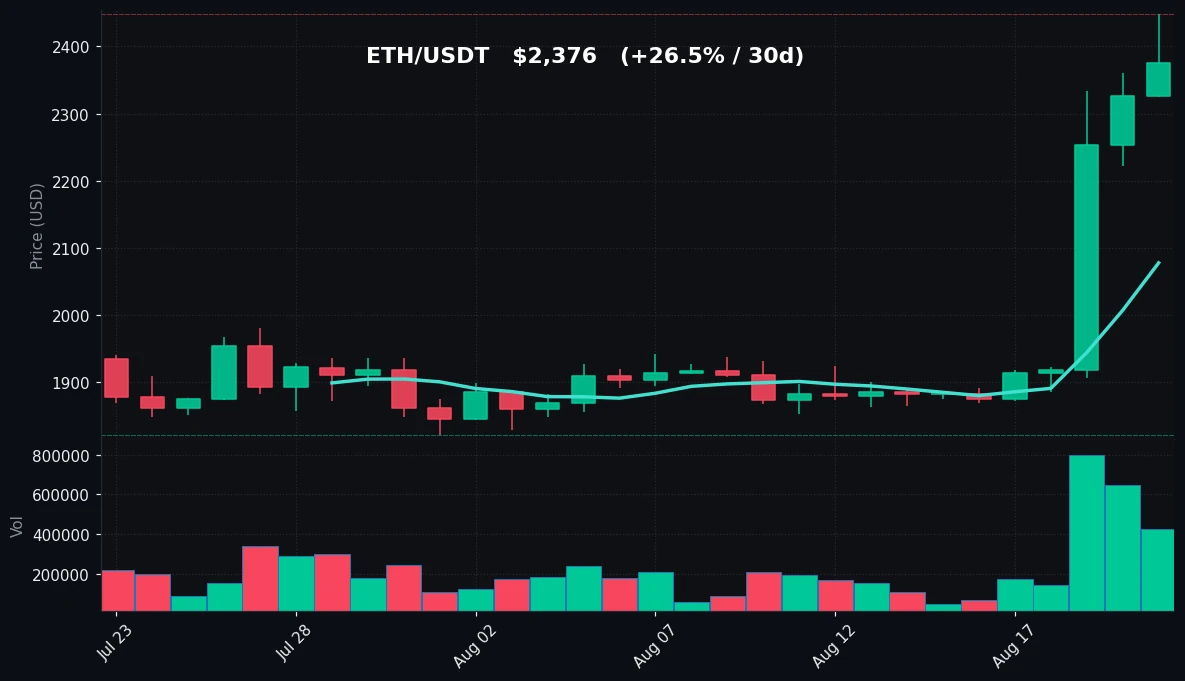
Ethereum (ETH) advanced 2.11% in the last 24 hours, trading at $2,376, with a 24-hour range of $2,448 to $2,325. The weekly gain is more pronounced at +26.23%, and the 30-day return is +26.49%. ETH sits above its MA7 ($2,078) and MA30 ($1,935), with a 7-day high of $2,448. Volume is elevated at 1.49x the 7-day average. Both assets exhibit extremely overbought RSI readings, with BTC at 86.9 and ETH at 90.1.
Bitcoin Analysis
TradingView Live (4h)
Bitcoin’s price action over the past 30 days shows a decisive upward trajectory, with the asset moving from a 30-day low of $62,275 to the current $76,827, a gain of approximately 23.4% from the bottom. The 7-day range ($62,716 to $79,500) encapsulates a sharp acceleration, with the price breaking through the $70,000 psychological level and now testing the $79,500 resistance zone.
The MA7 ($67,776) sits well below the current price, indicating that the short-term trend is aggressively bullish. The MA30 ($64,938) is even further below, confirming a sustained uptrend over the past month. The gap between the price and MA7 is approximately $9,000, which historically signals a strong momentum phase but also raises the risk of mean reversion.
Volume at 2.0x the 7-day average is a significant signal. This elevated volume accompanies the price surge, suggesting that the move is backed by genuine market participation rather than thin liquidity. However, it’s important to note that such volume spikes, when combined with extreme RSI readings, often precede short-term consolidation or pullbacks.
The RSI(14) at 86.9 is in deeply overbought territory. This reading indicates that buying pressure has been relentless, but it also suggests that the asset is technically stretched. In the past, BTC has shown that RSI levels above 85 can persist for several days during strong bull runs, but they are rarely sustainable without at least a pause.
The 24-hour high of $79,500 serves as immediate resistance, with the 7-day high matching this level. The $73,027 low from today’s session provides a near-term support reference, though the MA7 at $67,776 is a more robust support level if a deeper correction occurs.
The current price action is characterized by high momentum, elevated volume, and extreme overbought conditions. The market is in a clear trend phase, with no signs of distribution yet, but the technical indicators are flashing caution signals for short-term traders.
Ethereum Analysis
TradingView Live (4h)
Ethereum has outperformed Bitcoin on a relative basis over the past week, posting a 26.23% gain compared to BTC’s 21.86%. The 30-day performance is also stronger, with ETH up 26.49% versus BTC’s 18.01%. This suggests that capital is rotating into ETH, possibly as a laggard catch-up trade or due to network-specific developments.
The price structure shows a similar pattern to BTC, with the 30-day low of $1,822 and the current price of $2,376 representing a 30.4% gain from the bottom. The 7-day low of $1,869 to the 7-day high of $2,448 is a wide range, indicating significant volatility and a strong directional move.
ETH’s MA7 ($2,078) is below the current price, and the MA30 ($1,935) is even lower, confirming a bullish alignment. The distance between price and MA7 is approximately $300, which is substantial for ETH and indicates a fast-moving market.
Volume at 1.49x the 7-day average is elevated but lower than BTC’s volume multiple. This suggests that while ETH is moving, the participation level is slightly less intense than in BTC. This could be a sign that ETH’s move is being driven by a narrower set of buyers, or that the market is waiting for confirmation before committing more capital.
The RSI(14) at 90.1 is extremely overbought — higher than BTC’s reading. This is an unusual level, and historically, ETH has rarely sustained RSI above 90 for extended periods. The last time ETH traded in this RSI zone, it was followed by a sharp but brief correction before the trend resumed.
The $2,448 level (24-hour and 7-day high) is the immediate resistance. The $2,325 low from today provides near-term support, with the MA7 at $2,078 as a stronger support zone. The $1,935 MA30 is a longer-term support that would only be tested in a significant correction.
ETH’s higher beta is evident in both its upside and its RSI reading. The asset is moving faster than BTC in percentage terms, which is typical in strong bull markets. However, this also means that any reversal could be more violent for ETH than for BTC.
Key Technical Levels
| Asset | Support | Resistance | RSI |
|---|---|---|---|
| BTC | $73,027 | $79,500 | Overbought (86.9) |
| ETH | $2,325 | $2,448 | Overbought (90.1) |
BTC vs ETH Dynamic
The correlation between BTC and ETH remains high, with both assets moving in the same direction over the past 30 days. However, the magnitude of moves differs notably. ETH has outperformed BTC on a 7-day and 30-day basis, suggesting that the ETH/BTC ratio is rising. This is a common pattern in mid-cycle bull markets where capital flows from BTC into higher-beta altcoins. The volume data supports this interpretation, with ETH’s volume multiple (1.49x) being lower than BTC’s (2.0x), which could indicate that ETH’s move is less crowded. If the trend continues, ETH may continue to outpace BTC, but if the market turns, ETH could see sharper declines due to its higher beta. The RSI differential (90.1 vs 86.9) also suggests that ETH is more stretched relative to its own history than BTC.
Strategy Fit
Given the current market conditions — strong uptrend, elevated volume, and extreme RSI readings — the most suitable approach depends on the trader’s risk tolerance and time horizon.
Trend-following strategies are currently in play, as the price is above both MA7 and MA30 with clear upward momentum. A simple trend-following bot that buys dips and sells rallies would have performed well over the past week. On Pionex, the Trend Following Bot or Grid Bot with a wide range can capture this volatility.
Grid trading is particularly relevant given the wide daily ranges. BTC’s 24-hour range was $6,473 (from $73,027 to $79,500), and ETH’s was $123. A Grid Bot set to trade within these ranges could profit from the intraday oscillations. However, given the strong trend, a Trailing Grid Bot or a grid with an upward bias (more buy orders below, fewer sell orders above) would be more appropriate than a neutral grid.
DCA (Dollar-Cost Averaging) is less suited for the current environment. With RSI in extreme overbought territory, adding new capital at current prices carries elevated risk of short-term drawdown. A DCA Bot would be more effective if the market pulls back to the MA7 level ($67,776 for BTC, $2,078 for ETH), where the risk-reward is more balanced.
Caution is advised for new entries at current levels. The market is extended, and the probability of a short-term pullback is elevated based on RSI alone. Pionex’s Reverse Grid Bot (which profits from down moves) could be considered as a hedge, but only for traders comfortable with counter-trend positioning.
The most balanced approach would be a Grid Bot with a range that encompasses both the current price and the MA7 level, allowing for capture of both continuation and mean-reversion moves.
Risk Disclaimer
This market recap is for informational and educational purposes only and does not constitute financial advice, investment advice, trading advice, or any other form of professional advice. Cryptocurrency markets are highly volatile and involve substantial risk of loss. Past performance is not indicative of future results. The technical indicators, support/resistance levels, and strategy suggestions presented herein are based on historical data and statistical analysis, and they may not accurately predict future market behavior. You should consult with a qualified financial advisor before making any investment decisions. Trading bots, including those offered by Pionex, do not guarantee profits and may result in losses. Never invest more than you can afford to lose. The author and publisher of this recap are not responsible for any financial losses incurred as a result of acting on the information provided.
FAQ
Q1: Why is the RSI so high for both BTC and ETH?
The RSI (Relative Strength Index) measures the magnitude of recent price changes to evaluate overbought or oversold conditions. Readings above 70 are considered overbought. Current readings of 86.9 (BTC) and 90.1 (ETH) indicate that buying pressure has been exceptionally strong and sustained over the past 14 days. This happens during rapid price appreciation phases when buyers overwhelm sellers. High RSI does not automatically mean a price drop is imminent, but it does signal that the asset is technically stretched and vulnerable to a pullback.
Q2: What is the significance of the volume being 2.0x the 7-day average for BTC?
Volume is a measure of market participation. A volume of 2.0x the 7-day average means that today’s trading activity is double the recent norm. This is significant because it confirms that the price move is backed by real capital flows rather than thin order books. High volume during an uptrend suggests strong conviction among buyers. However, if the price stalls or reverses on such high volume, it could indicate distribution (selling) by large holders.
Q3: What are the key support and resistance levels to watch?
For BTC, the immediate support is $73,027 (today’s low), followed by the MA7 at $67,776. The resistance is $79,500, which is both today’s high and the 7-day high. For ETH, support is at $2,325 (today’s low) and the MA7 at $2,078. Resistance is at $2,448 (today’s and 7-day high). These levels are derived from recent price action and moving averages.
Q4: How do the MA7 and MA30 help in understanding the trend?
The MA7 (7-day moving average) reflects the short-term trend, while the MA30 (30-day moving average) reflects the medium-term trend. When the price is above both MAs, it confirms an uptrend. The gap between the price and the MAs indicates the strength of the trend. A widening gap, as seen currently, means the trend is accelerating. If the price falls below the MA7, it could signal a short-term trend reversal; falling below the MA30 would indicate a more significant correction.
Q5: What is the difference between the 24h high/low and the 7d high/low?
The 24h high/low represents the highest and lowest prices traded in the last 24 hours, providing a snapshot of the most recent session’s volatility. The 7d high/low shows the extremes over the past week, giving a broader view of the recent trading range. Comparing these can help identify whether the asset is making new highs or lows. Currently, BTC’s 24h high ($79,500) equals the 7d high, indicating that the asset is at its weekly peak.


