BTC ETH Daily Recap — 2026-08-23

BTC ETH Daily Recap — 2026-08-23
Today at a Glance
Bitcoin (BTC) is trading at $77,556, up 0.62% over the last 24 hours, with an intraday range between $75,546 and $77,766. The asset remains in a strong uptrend, posting a 23.30% gain over the past seven days and a 20.48% increase over the last 30 days. Notably, BTC sits just 2.5% below its 7-day high of $79,500. Ethereum (ETH) has shown even more momentum, rising 1.65% today to $2,463, with a 31.27% weekly gain and a 31.34% monthly gain. ETH’s 24-hour range was $2,356 to $2,484, and it remains about 3.3% below its 7-day high of $2,547. Both assets are exhibiting strong bullish momentum, though volume has tapered to roughly half of their 7-day averages, suggesting a potential pause in buying pressure. The RSI for both BTC and ETH sits at 82.8, indicating overbought conditions. The market is consolidating recent sharp gains, with both assets holding above key moving averages.
Bitcoin Analysis
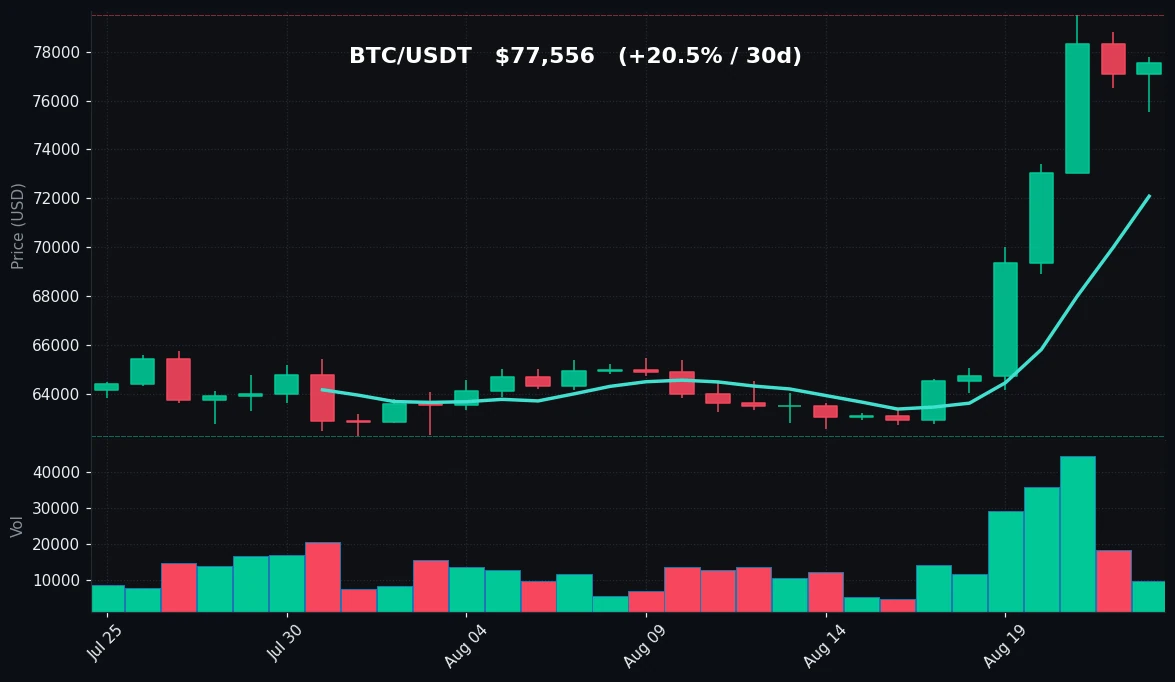
TradingView Live (4h)
Bitcoin’s price action over the past week has been decisively bullish. From a 7-day low of $62,751, BTC surged to a peak of $79,500 before pulling back slightly to its current level of $77,556. The 30-day low of $62,275 underscores the magnitude of this rally — a move of more than 24% from the bottom of its monthly range. Today’s trading session shows a relatively narrow range ($75,546 – $77,766), indicating that the market is consolidating after the recent sharp advance.
From a technical perspective, BTC is trading well above both the 7-day moving average (MA7) of $72,084 and the 30-day moving average (MA30) of $65,835. The price-to-MA7 spread is approximately 7.6%, while the price-to-MA30 spread is roughly 17.8%. This wide gap suggests that the short-term trend is strongly extended, which often accompanies the final stages of a rapid move higher. The MA7 has crossed decisively above the MA30, confirming a bullish crossover that typically signals sustained upward momentum.
The Relative Strength Index (RSI) for BTC stands at 82.8, firmly in overbought territory (above 70). This reading indicates that buying pressure has been exceptionally strong, but it also suggests that the asset is technically stretched and may be vulnerable to a pullback or period of sideways consolidation. It is important to note that in strong trends, RSI can remain overbought for extended periods, so this reading alone does not signal an immediate reversal.
Volume analysis reveals a notable divergence. The current volume is only 0.44x the 7-day average, indicating that the recent price rally has occurred on declining participation. This suggests that the latest leg higher may be driven by relatively thin liquidity, which can amplify volatility in both directions. During the sharp ascent from $62,751 to $79,500, volume was likely elevated, but the current consolidation phase is occurring on reduced activity.
Key technical levels to monitor include immediate support at $75,546 (today’s low) and the psychological $75,000 mark. Below that, the MA7 at $72,084 serves as a more substantial support zone, as it has been tested and held during the recent rally. On the upside, resistance sits at $79,500 (the 7-day and 30-day high), with a breakout above this level potentially opening the path toward uncharted territory. The current price action suggests a market that is pausing to digest gains, with the overbought RSI and declining volume pointing to a potential short-term consolidation or minor retracement.
Ethereum Analysis
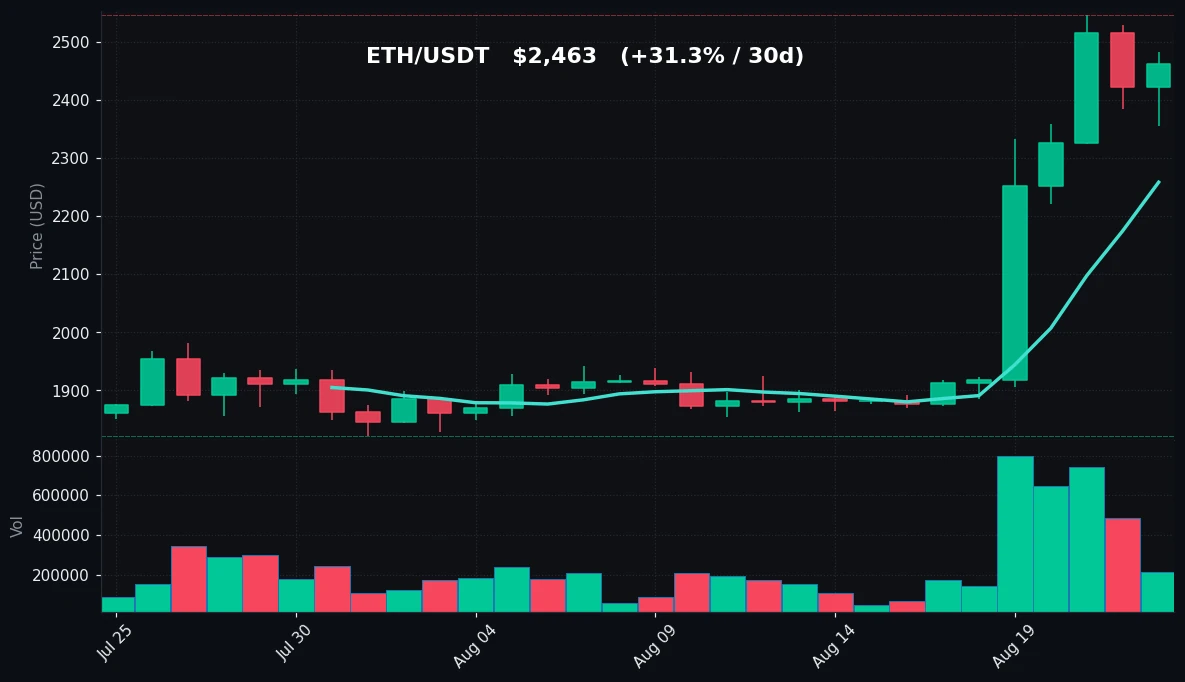
TradingView Live (4h)
Ethereum is exhibiting even stronger relative performance than Bitcoin, with a 31.27% gain over the past seven days. From a 7-day low of $1,872, ETH surged to a high of $2,547 before settling at its current price of $2,463. The 30-day low of $1,822 highlights the scale of the recovery — ETH has climbed approximately 35% from its monthly bottom. Today’s session shows a range of $2,356 to $2,484, with the asset closing near the upper end of that range, indicating sustained buying interest.
Ethereum’s moving average structure is similarly bullish to Bitcoin’s. The price is trading above the MA7 of $2,259 and the MA30 of $1,978, with spreads of approximately 9.0% and 24.5%, respectively. The wider spread relative to the MA30 reflects ETH’s stronger recent performance compared to BTC. The MA7 has crossed above the MA30, confirming a bullish crossover. The gap between the two moving averages is widening, which typically indicates strengthening trend momentum.
The RSI for ETH is also at 82.8, identical to Bitcoin’s reading, placing it in overbought territory. This symmetry between the two assets suggests that the broader crypto market is experiencing synchronized buying pressure, likely driven by macro factors or sector-wide sentiment rather than asset-specific catalysts. The overbought RSI, combined with the extended price distance from the MA30, suggests that ETH may be due for a period of consolidation.
Volume analysis shows ETH’s current volume at 0.49x its 7-day average, similar to Bitcoin’s pattern. This declining volume during the consolidation phase indicates that the sharp rally from $1,872 to $2,547 was likely accompanied by higher trading activity, but the current pause is occurring on reduced participation. This pattern can be interpreted as a natural market breather rather than a distribution phase, though it does warrant caution as lower volume can lead to sharp price swings.
Key levels for Ethereum include immediate support at $2,356 (today’s low) and the psychological $2,300 level. The MA7 at $2,259 provides a more robust support zone, as it has been respected during the recent uptrend. On the resistance side, $2,547 (the 7-day and 30-day high) is the critical level to watch. A sustained move above this level would signal a continuation of the uptrend, while a failure to hold current levels could see ETH retest the MA7 support. The current technical setup suggests that ETH is in a strong uptrend but is facing short-term overbought conditions.
Key Technical Levels
| Asset | Support | Resistance | RSI |
|---|---|---|---|
| BTC | $75,546 (today’s low) / $72,084 (MA7) | $79,500 (7d/30d high) | Overbought (82.8) |
| ETH | $2,356 (today’s low) / $2,259 (MA7) | $2,547 (7d/30d high) | Overbought (82.8) |
BTC vs ETH Dynamic
The correlation between Bitcoin and Ethereum remains exceptionally high, with both assets trading at identical RSI readings of 82.8 and exhibiting similar price patterns over the past week. However, Ethereum has outperformed Bitcoin in relative terms, posting a 31.27% weekly gain versus BTC’s 23.30%. This divergence in performance is notable — ETH’s beta to BTC appears to be approximately 1.34 over the past week, meaning ETH has amplified Bitcoin’s moves by roughly a third. Both assets are consolidating after sharp rallies, with volume declining to similar levels (0.44x for BTC and 0.49x for ETH relative to their 7-day averages). The synchronized price action suggests that the current market dynamics are driven by macro factors affecting the entire crypto asset class, rather than asset-specific news. Traders should monitor whether this correlation persists, as a breakdown in the relationship could signal a shift in market leadership or a change in the underlying demand dynamics for either asset.
Strategy Fit
Given the current market conditions — strong uptrend, overbought RSI, and declining volume — the prevailing environment is characterized by high volatility with a potential for short-term consolidation or pullback. The 7-day gains of 23-31% for BTC and ETH respectively indicate that trend-following strategies have been highly effective over the past week. However, the overbought RSI readings suggest that chasing the market at current levels carries elevated risk of a short-term correction.
For traders with a longer time horizon, a trend-following approach remains appropriate, given that both assets are trading above their key moving averages with a bullish crossover in place. The use of trailing stop-losses or moving average-based exits (e.g., below the MA7) can help lock in profits while allowing the trend to continue.
For those looking to capitalize on the current consolidation phase, grid trading may be a suitable strategy. The relatively tight intraday ranges ($75,546 – $77,766 for BTC and $2,356 – $2,484 for ETH) suggest that prices are oscillating within a defined band. A grid bot can automatically place buy and sell orders within this range, profiting from the oscillation without requiring directional calls. Pionex offers built-in grid trading bots that can be configured for both BTC and ETH, allowing traders to set upper and lower price bounds based on the key support and resistance levels identified above.
Dollar-cost averaging (DCA) remains a prudent strategy for investors with a long-term perspective. The current overbought conditions suggest that entering large positions at current prices carries short-term risk, but a DCA approach that spreads entries over time can smooth out the volatility. Pionex’s DCA bots automate this process, allowing users to set regular buy intervals.
Given the overbought RSI and declining volume, a conservative approach may be warranted in the short term. Traders could consider reducing position sizes or waiting for a pullback to the MA7 support levels before initiating new longs.
Risk Disclaimer
This market recap is provided for informational and educational purposes only and does not constitute financial advice, investment advice, trading advice, or any other form of professional advice. Cryptocurrency markets are highly volatile and involve substantial risk of loss. Past performance is not indicative of future results. The data presented herein is based on information available as of 2026-08-23 and may be subject to change without notice. You should conduct your own research and consult with a qualified financial advisor before making any investment decisions. Neither the author nor any affiliated entity shall be liable for any losses or damages arising from reliance on the information contained in this document. Always trade responsibly and never invest more than you can afford to lose.
FAQ
Q1: Why is the RSI overbought for both BTC and ETH?
The RSI (Relative Strength Index) measures the magnitude of recent price changes to evaluate overbought or oversold conditions. A reading above 70 is typically considered overbought. Both BTC and ETH have RSI values of 82.8, reflecting the strong upward momentum over the past week and month. This indicates that buying pressure has been intense, but it also suggests that the assets may be due for a short-term pullback or consolidation.
Q2: What does the declining volume relative to the 7-day average indicate?
Current volume for BTC is 0.44x and for ETH is 0.49x of their respective 7-day averages. This decline suggests that the recent price rally is occurring on reduced trading activity. Lower volume during a consolidation phase can indicate a pause in buying pressure, but it can also lead to higher volatility as thinner liquidity means larger price swings from smaller orders.
Q3: What are the key support and resistance levels to watch?
For BTC, immediate support is at $75,546 (today’s low), with stronger support at the MA7 of $72,084. Resistance is at $79,500 (the 7-day and 30-day high). For ETH, support is at $2,356 (today’s low) and $2,259 (MA7), with resistance at $2,547 (the 7-day and 30-day high). These levels are based on recent price action and moving averages.
Q4: How does the BTC vs ETH correlation affect trading strategies?
The high correlation (both assets have identical RSI readings and similar price patterns) means that strategies applied to one asset can often be applied to the other. However, ETH has shown higher beta (amplifying BTC’s moves), which means it may provide higher returns in an uptrend but also larger losses in a downtrend. Traders should consider this when sizing positions.
Q5: What is the significance of the MA7 and MA30 crossover?
The MA7 (7-day moving average) crossing above the MA30 (30-day moving average) is a bullish signal, indicating that short-term momentum is stronger than longer-term momentum. For both BTC and ETH, the MA7 is well above the MA30, confirming a strong uptrend. The widening gap between these averages suggests accelerating bullish momentum, though it also indicates that the price is extended relative to recent averages.


