BTC ETH Daily Recap — July 24, 2026

BTC ETH Daily Recap — July 24, 2026
Today at a Glance
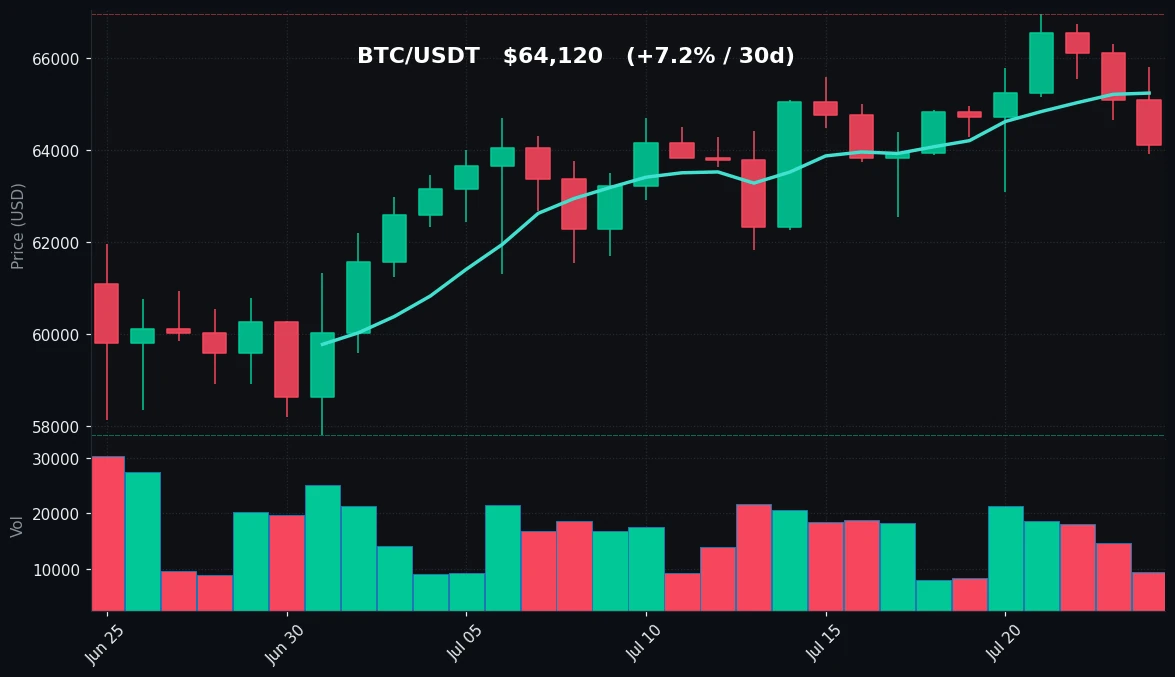
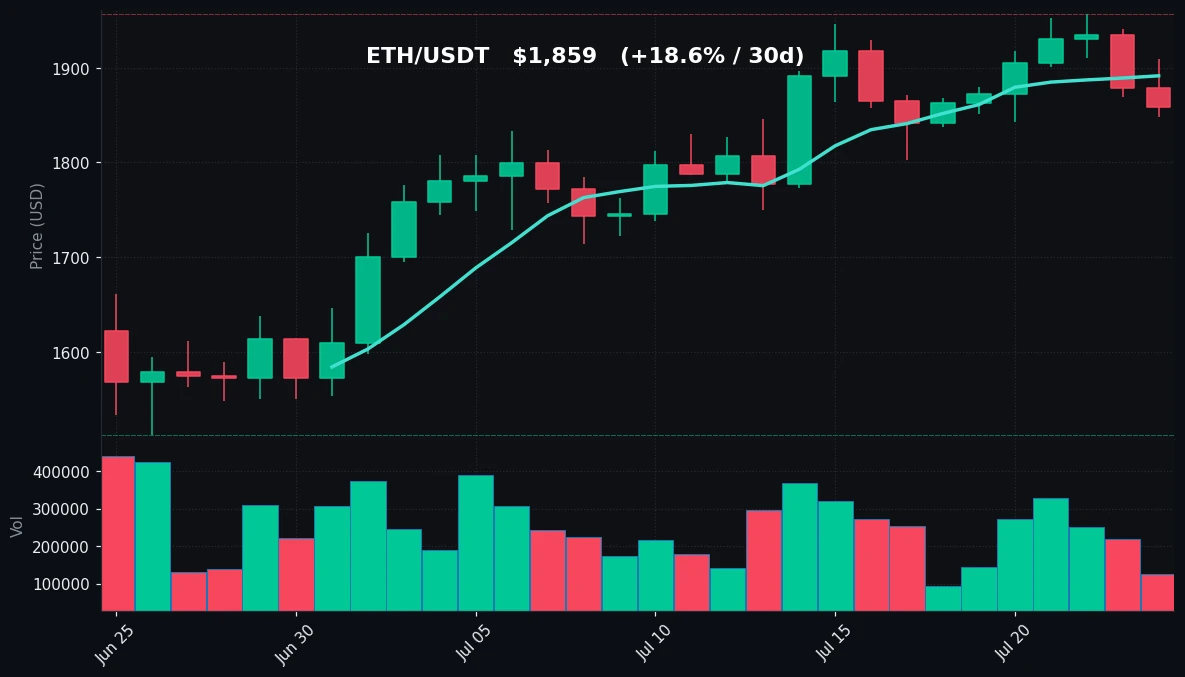
The crypto market experienced a mild pullback on July 24, with Bitcoin and Ethereum both trading in the red over the past 24 hours. BTC/USDT slipped 1.50% to $64,120, retreating from a daily high of $65,809 and briefly testing support near $63,920. The weekly performance remains marginally positive at +0.29%, while the 30-day trend shows a solid +7.23% gain. Ethereum followed a similar pattern, declining 1.05% to $1,859, with a daily range between $1,910 and $1,848. ETH’s weekly gain of +0.91% and impressive 30-day rally of +18.55% highlight its relative strength compared to Bitcoin. Trading volumes for both assets are significantly below their 7-day averages, suggesting reduced participation and potential consolidation. The RSI readings—49.8 for BTC and 57.0 for ETH—indicate neutral to slightly bullish momentum, with neither asset in overbought or oversold territory.
Bitcoin Analysis
TradingView Live (4h)
Bitcoin’s price action on July 24 reflects a cautious market environment. After reaching a 30-day high of $66,956 earlier in the week, BTC has pulled back to $64,120, now trading below the 7-day moving average of $65,243. The 30-day moving average at $63,021 provides a key support level, and the current price remains comfortably above it, suggesting the medium-term uptrend is intact. The intraday low of $63,920 tested the $64,000 psychological support area, which has historically acted as a pivot zone.
The Relative Strength Index (RSI) at 49.8 sits right at the neutral 50 mark, indicating that buying and selling pressure are nearly balanced. This neutral reading often precedes a directional move, but the current lack of momentum suggests traders are waiting for a catalyst. Volume is notably subdued at 0.61x the 7-day average, confirming that today’s decline is not accompanied by aggressive selling—rather, it appears to be a low-volume drift lower.
From a technical perspective, Bitcoin is consolidating between the $63,100 weekly low and $66,956 weekly high. The $65,243 MA7 acts as immediate resistance; a reclaim of this level would signal renewed bullish intent. Conversely, a break below $63,920 could see a test of the $63,100 support zone, which aligns with the 30-day MA at $63,021. The 30-day range from $57,800 to $66,956 shows that Bitcoin has rallied over 14% from its monthly low, and the current pullback could be a healthy retracement within an uptrend. The absence of volume spikes during the decline suggests that large-scale distribution is not occurring, but the lack of buying interest keeps the market in a waiting pattern.
Ethereum Analysis
TradingView Live (4h)
Ethereum’s performance today shows relative resilience compared to Bitcoin, with a smaller 24-hour decline of 1.05%. Trading at $1,859, ETH remains above both its 7-day MA ($1,892) and 30-day MA ($1,770), though it has slipped below the 7-day average. The daily range of $1,910 high and $1,848 low indicates a tightening range, with support forming near the $1,850 level. The weekly high of $1,956 and low of $1,838 define the short-term trading band.
The RSI at 57.0 is firmly in neutral-to-bullish territory, suggesting that the uptrend from the 30-day low of $1,512 (+22.9%) still has momentum. However, the volume reading of 0.56x the 7-day average mirrors Bitcoin’s low participation, implying that the current price level is not attracting significant new buying interest. The 30-day MA at $1,770 provides a solid support floor, and the gap between current price and this moving average ($89 or 4.8%) suggests that ETH is not overextended relative to its recent average.
Key resistance levels to watch include the $1,910 daily high and the $1,956 weekly high. A break above $1,956 would target the psychological $2,000 level, which has not been seen since early June. On the downside, the $1,838 weekly low is the first support, followed by the $1,770 MA30. Ethereum’s stronger 30-day performance (+18.55% vs BTC’s +7.23%) indicates that capital is rotating into ETH, possibly driven by expectations of network upgrades or DeFi activity. The current pullback appears to be a normal consolidation after a strong rally, with no technical breakdown signals.
Key Technical Levels
| Asset | Support | Resistance | RSI |
|---|---|---|---|
| BTC | $63,100 / $63,021 (MA30) | $65,243 (MA7) / $66,956 | Neutral (49.8) |
| ETH | $1,838 / $1,770 (MA30) | $1,910 / $1,956 | Neutral (57.0) |
BTC vs ETH Dynamic
The correlation between Bitcoin and Ethereum remains high, as both assets declined in tandem today. However, the magnitude of the decline differs: BTC’s 1.50% drop is nearly 50% larger than ETH’s 1.05% decline, continuing a trend where ETH has shown relative strength over the past 30 days. The ETH/BTC ratio has increased from approximately 0.026 at the start of July to 0.029 today, reflecting capital rotation from Bitcoin to Ethereum. This dynamic often occurs during mid-cycle bull phases when traders seek higher-beta assets. The volume disparity (ETH at 0.56x vs BTC at 0.61x of their respective 7-day averages) suggests that Ethereum’s lower decline is not due to higher buying volume but rather to less selling pressure, which could indicate stronger holder conviction.
Strategy Fit
The current market conditions—low volatility, neutral RSI readings, and below-average volume—favor range-bound trading strategies. For Bitcoin, the established range between $63,100 and $66,956 provides clear boundaries for a grid trading bot. A grid strategy that buys near support ($63,100-$63,500) and sells near resistance ($65,500-$66,956) can capitalize on the current consolidation. Pionex’s built-in grid trading bot is well-suited for this environment, as it automatically places buy and sell orders within a defined price range, profiting from small price oscillations.
For Ethereum, which has shown stronger momentum, a DCA (Dollar-Cost Averaging) strategy may be appropriate for longer-term accumulation, given the uptrend from the $1,512 low. However, the current neutral RSI of 57.0 suggests that a DCA entry at current levels is reasonable but not optimal. A trend-following strategy using a trailing stop-loss could capture further upside if ETH breaks above $1,956 resistance. Pionex’s trailing stop bot can help lock in profits while allowing for continued upside.
Given the low volume, aggressive directional strategies are not recommended. The absence of a clear catalyst suggests that the market may continue to consolidate until a significant event (e.g., macroeconomic data, regulatory news) triggers a breakout. Conservative traders may prefer to wait for a volume confirmation before committing capital.
Risk Disclaimer
This market recap is for informational and educational purposes only and does not constitute financial advice, investment recommendation, or solicitation to buy or sell any digital assets. Cryptocurrency markets are highly volatile and involve substantial risk of loss. Past performance is not indicative of future results. Always conduct your own research and consult with a qualified financial advisor before making any investment decisions. The technical indicators and levels mentioned are based on historical data and may not predict future price movements accurately.
FAQ
Q: Why did Bitcoin and Ethereum drop today?
A: Both assets experienced mild declines of 1.50% and 1.05% respectively, likely due to profit-taking after recent rallies. Trading volumes are significantly below average, suggesting the move is driven by reduced buying interest rather than aggressive selling.
Q: What does the RSI of 49.8 for Bitcoin mean?
A: An RSI of 49.8 is neutral, indicating that Bitcoin is neither overbought nor oversold. This typically suggests the market is in equilibrium, with no strong directional bias. It often precedes a period of consolidation or a breakout.
Q: Is Ethereum outperforming Bitcoin?
A: Yes, over the past 30 days, Ethereum has gained +18.55% compared to Bitcoin’s +7.23%. The ETH/BTC ratio has risen from 0.026 to 0.029, confirming relative strength. This trend may continue if capital rotation persists.
Q: What are the key support and resistance levels for Bitcoin?
A: Key support levels are $63,100 (weekly low) and $63,021 (30-day moving average). Key resistance levels are $65,243 (7-day moving average) and $66,956 (weekly high). A break above or below these levels could determine the next trend direction.
Q: Should I buy or sell based on this analysis?
A: This analysis does not provide buy or sell recommendations. The neutral technical indicators suggest a wait-and-see approach. Consider using grid trading or DCA strategies to manage risk, and always align your decisions with your personal risk tolerance and investment goals.


