BTC ETH Daily Recap — 2026-08-24: Momentum Persists, Overbought Signals Flash

BTC ETH Daily Recap — 2026-08-24: Momentum Persists, Overbought Signals Flash
Today at a Glance
The crypto market continues its aggressive upward trajectory as both Bitcoin and Ethereum post strong gains on the daily and weekly timeframes. Bitcoin trades at $78,664, up 1.20% in the last 24 hours, while Ethereum mirrors this move with a 1.20% gain to $2,493. The weekly performance is particularly striking: BTC has rallied 21.90% over seven days, while ETH has outpaced it with a 30.28% surge. Both assets are trading near their 30-day highs, with BTC at $79,500 and ETH at $2,547. However, the Relative Strength Index (RSI) for both assets sits at extremely elevated levels — 87.7 for BTC and 87.2 for ETH — indicating a severely overbought condition. Volume has contracted compared to the 7-day average (0.68x for BTC, 0.56x for ETH), suggesting that the recent price advance is occurring on thinner participation. The moving averages remain firmly bullish, with price well above both MA7 and MA30 for each asset.
Bitcoin Analysis
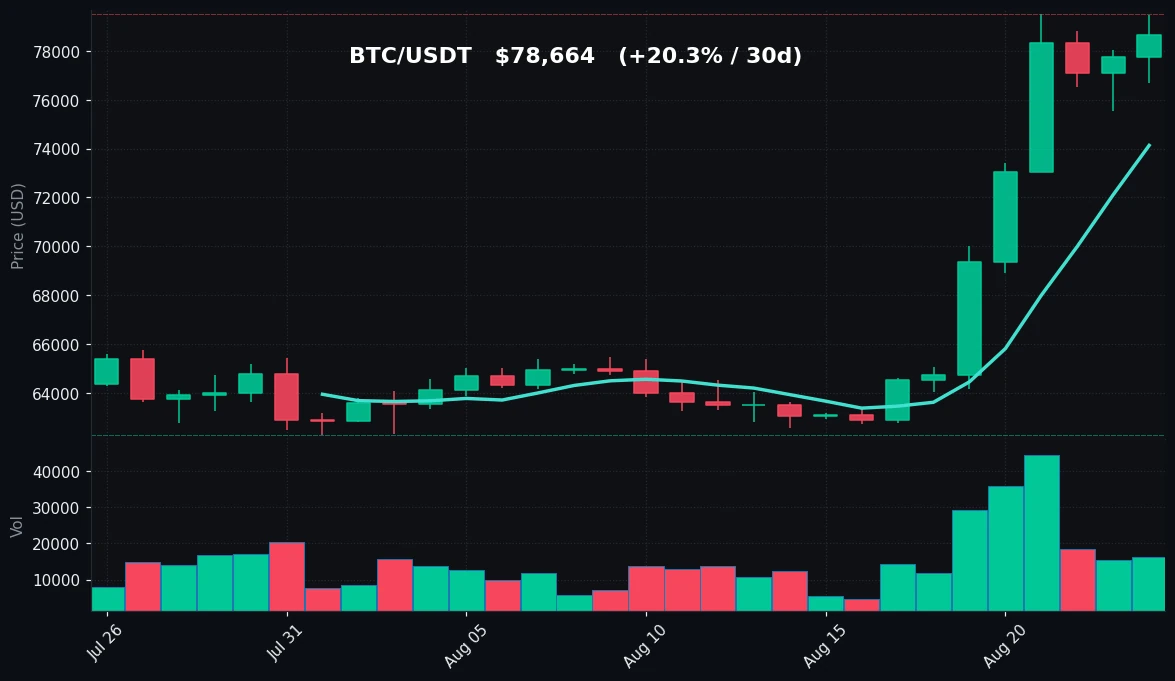
TradingView Live (4h)
Bitcoin’s price action over the past month has been nothing short of extraordinary. The asset bottomed at $62,275 on a 30-day basis and has since climbed to a high of $79,500, representing a gain of approximately 27.7% from the local trough. The 7-day low of $64,028 highlights the rapid acceleration that has occurred within the last week alone — a move of over $15,000 (24.1%) from that level to the current price of $78,664.
The technical structure is firmly bullish. BTC is trading well above both its 7-day moving average of $74,128 and its 30-day moving average of $66,317. The spread between these two MAs — approximately $7,811 — indicates strong short-term momentum that has pushed price significantly ahead of the longer-term average. This type of MA expansion often accompanies strong trend phases, though it also raises the risk of mean-reversion if momentum stalls.
Volume analysis reveals a notable divergence. Despite the strong price advance, current volume is running at only 0.68x the 7-day average. This suggests that the latest leg higher is being driven by relatively thin liquidity. In a trending market, declining volume during price advances can sometimes signal exhaustion, though it can also simply reflect a quiet weekend session. The 24-hour range of $76,670 to $79,450 shows that buyers have maintained control, with the close near the upper end of the range.
The RSI reading of 87.7 is the most concerning technical signal. Readings above 70 are traditionally considered overbought, and a level near 88 places BTC in extreme overbought territory. Historically, such readings have preceded either a consolidation phase or a sharp pullback. However, in strong bull markets, RSI can remain elevated for extended periods. The key technical level to watch is the $79,500 resistance, which has capped price twice in the recent period. Support sits at the MA7 of $74,128, followed by the psychological $75,000 level.
Ethereum Analysis
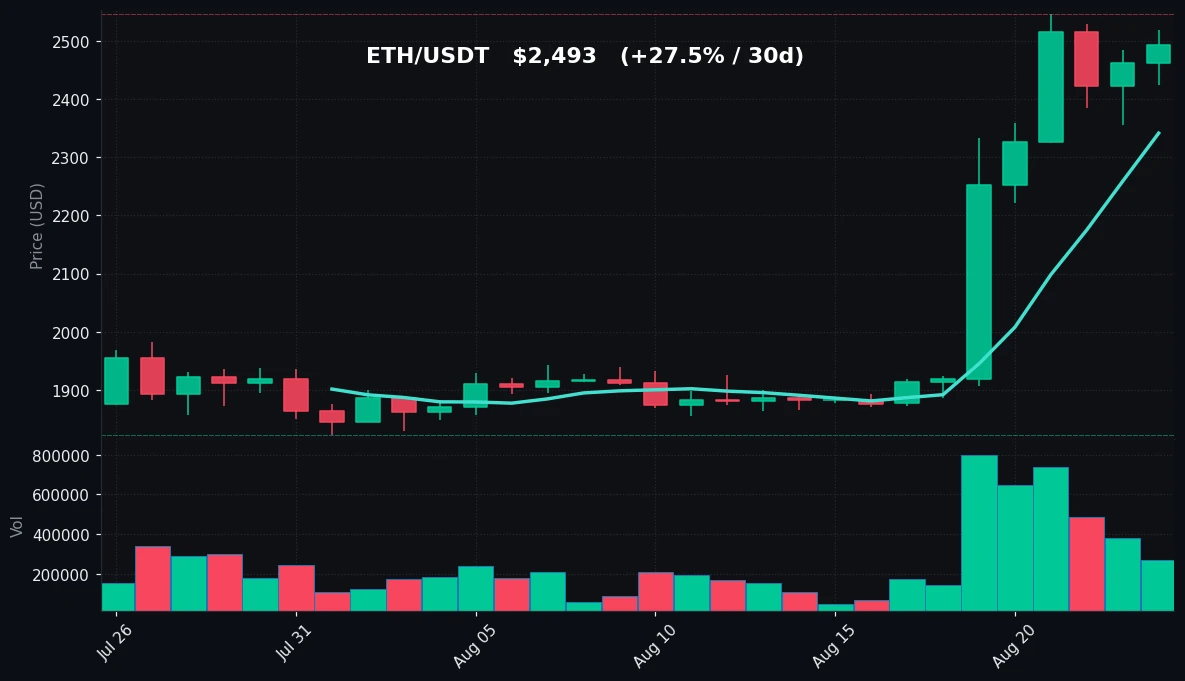
TradingView Live (4h)
Ethereum has demonstrated even stronger relative performance than Bitcoin over the past week. The asset has surged 30.28% in seven days, moving from a low of $1,886 to a high of $2,547. On a 30-day basis, ETH has gained 27.54%, recovering from a low of $1,822. The current price of $2,493 places ETH just 2.1% below its 30-day high.
The moving average structure for ETH is similarly bullish. Price sits comfortably above the MA7 of $2,342 and the MA30 of $1,998. The gap between these averages — $344 — reflects the strong upward momentum. Notably, ETH has reclaimed the $2,500 psychological level, though it has not yet closed decisively above the $2,547 high.
Volume data for ETH shows an even more pronounced contraction than BTC, with current volume at just 0.56x the 7-day average. This is a significant decline and suggests that the recent rally has been driven by spot buying rather than derivative-driven speculation. The 24-hour range of $2,425 to $2,520 shows relatively contained intraday movement, with the price consolidating near the upper boundary.
The RSI for ETH at 87.2 mirrors BTC’s extreme overbought condition. This is the second consecutive day that ETH has posted an RSI above 85, a level not seen in recent months. The technical setup suggests that while the trend remains firmly upward, the risk-reward for new entries at current levels is skewed toward a short-term pullback.
Key levels for ETH include resistance at $2,547 (the 30-day high) and support at $2,342 (MA7), followed by the $2,250 area which served as resistance-turned-support earlier in the week. The $1,998 MA30 represents a major support zone if a deeper correction were to occur.
Key Technical Levels
| Asset | Support | Resistance | RSI |
|---|---|---|---|
| BTC | $74,128 (MA7) | $79,500 | overbought |
| ETH | $2,342 (MA7) | $2,547 | overbought |
Both assets are exhibiting identical technical conditions: strong uptrends, price above key moving averages, but RSI readings that have entered extreme overbought territory. The supports listed represent the first line of defense for bulls, while the resistance levels are the immediate upside targets that have yet to be decisively broken.
BTC vs ETH Dynamic
The correlation between Bitcoin and Ethereum remains exceptionally high, with both assets moving in near-lockstep. Over the past 24 hours, both have gained exactly 1.20%, and their weekly performance differential (BTC +21.90% vs ETH +30.28%) reflects ETH’s higher beta rather than a divergence in market direction. This suggests that the current market phase is driven by macro factors affecting the entire crypto asset class, rather than asset-specific catalysts. The ETH/BTC ratio has been trending higher, indicating that ETH is outperforming BTC on a relative basis. This is typical in risk-on phases where investors allocate to higher-volatility assets. However, the extreme RSI readings on both assets suggest that if a correction occurs, it will likely affect both simultaneously, with ETH potentially experiencing larger percentage drawdowns due to its higher volatility profile.
Strategy Fit
The current market environment presents a unique challenge for traders. The strong uptrend is undeniable, but the extreme overbought conditions (RSI > 87) and declining volume create an asymmetric risk profile for new entries. For trend-following strategies, the current setup favors continuation plays, but position sizing should account for the elevated risk of a sharp pullback.
Grid Trading: The recent volatility — with 7-day ranges of $15,472 for BTC and $661 for ETH — provides excellent opportunities for grid trading strategies. A grid bot can capture profits from the oscillation between support and resistance levels. However, given the overbought conditions, a short-biased or neutral grid might be more appropriate than a purely long grid. Pionex’s grid bots allow users to set upper and lower price ranges, which can be adjusted to the current support/resistance levels identified above.
DCA (Dollar-Cost Averaging): For longer-term investors, the current overbought conditions suggest that a disciplined DCA approach is preferable to lump-sum entries. Pionex’s DCA bots can be configured to accumulate positions at regular intervals, smoothing out the entry price over time. Given the extreme RSI readings, starting a DCA strategy with a lower initial allocation and higher buy-the-dip triggers could be prudent.
Trend Following: The clear uptrend favors trend-following strategies, but the volume contraction is a warning sign. A trailing stop-loss approach or a momentum-based strategy with strict exit rules would be appropriate. Pionex’s trailing take-profit and stop-loss features can automate this process, allowing traders to let profits run while protecting against sudden reversals.
The most prudent approach in this environment is to combine strategies: maintain a core position via DCA, use grid trading to profit from expected range-bound movement, and employ strict risk management given the overbought signals.
Risk Disclaimer
This market recap is provided for informational and educational purposes only and does not constitute financial advice, investment advice, trading advice, or any other sort of advice. Cryptocurrency markets are highly volatile and involve substantial risk of loss. Past performance is not indicative of future results. You should not make any investment decisions based solely on the information provided in this document. Always conduct your own research and consult with a qualified financial advisor before making any investment decisions. The technical indicators and levels mentioned in this report are for reference only and should not be interpreted as guarantees of future price movements. Trading cryptocurrencies involves risk, and you could lose all of your invested capital. Never invest money that you cannot afford to lose.
FAQ
What does an RSI above 87 mean for Bitcoin and Ethereum?
An RSI (Relative Strength Index) above 87 indicates that an asset is in extreme overbought territory. This means that the recent price gains have been rapid and that the asset may be due for a consolidation or pullback. However, in strong bull markets, RSI can remain in overbought territory for extended periods, so it should not be used as a standalone signal for exiting positions.
Why is volume declining if prices are rising?
Declining volume during a price advance can indicate that the move is being driven by fewer participants. This can be a sign of weakening momentum or simply reflect lower trading activity during certain periods (e.g., weekends). It is often considered a cautionary signal, especially when combined with overbought RSI readings.
What are the key support levels to watch for BTC and ETH?
For Bitcoin, the first major support is the 7-day moving average at $74,128, followed by the $75,000 psychological level. For Ethereum, support sits at the 7-day moving average of $2,342, with the $2,250 area as a secondary level. A break below these levels could signal a deeper correction.
How can I use grid trading in the current market?
Grid trading involves placing buy and sell orders at predetermined price levels within a range. Given the current volatility, a grid bot can profit from price oscillations between support and resistance levels. Pionex offers automated grid trading bots that can be configured with custom ranges based on the technical levels mentioned in this report.
Is it a good time to buy Bitcoin or Ethereum?
This report does not provide buy or sell recommendations. The technical indicators show a strong uptrend but also extreme overbought conditions. The decision to buy, sell, or hold should be based on your individual financial situation, risk tolerance, and investment goals. Consider using strategies like DCA to mitigate timing risk.


