BTC ETH Daily Recap — 2026-08-25: Momentum Cools After Parabolic Run

BTC ETH Daily Recap — 2026-08-25: Momentum Cools After Parabolic Run
Today at a Glance
The crypto market took a breather on August 25, 2026, as both Bitcoin and Ethereum pulled back slightly from their recent explosive gains. BTC traded at $78,728, down 0.34% over the past 24 hours, after touching a 7-day high of $81,273. Despite the intraday dip, the broader weekly picture remains strongly bullish: BTC is up +21.63% over the last 7 days and +23.48% over 30 days. Ethereum showed a similar pattern, easing 0.80% to $2,462, after reaching a weekly high of $2,547. However, ETH’s momentum metrics are even more striking — a +28.40% weekly gain and +30.12% monthly appreciation. Both assets are trading far above their moving averages, with BTC’s MA7 at $76,175 and ETH’s at $2,418. The key story today is cooling volume (BTC at 0.66x of its 7-day average, ETH at 0.42x) and extremely elevated RSI readings, signaling that the market is in a consolidation phase after a sharp run-up.
Bitcoin Analysis
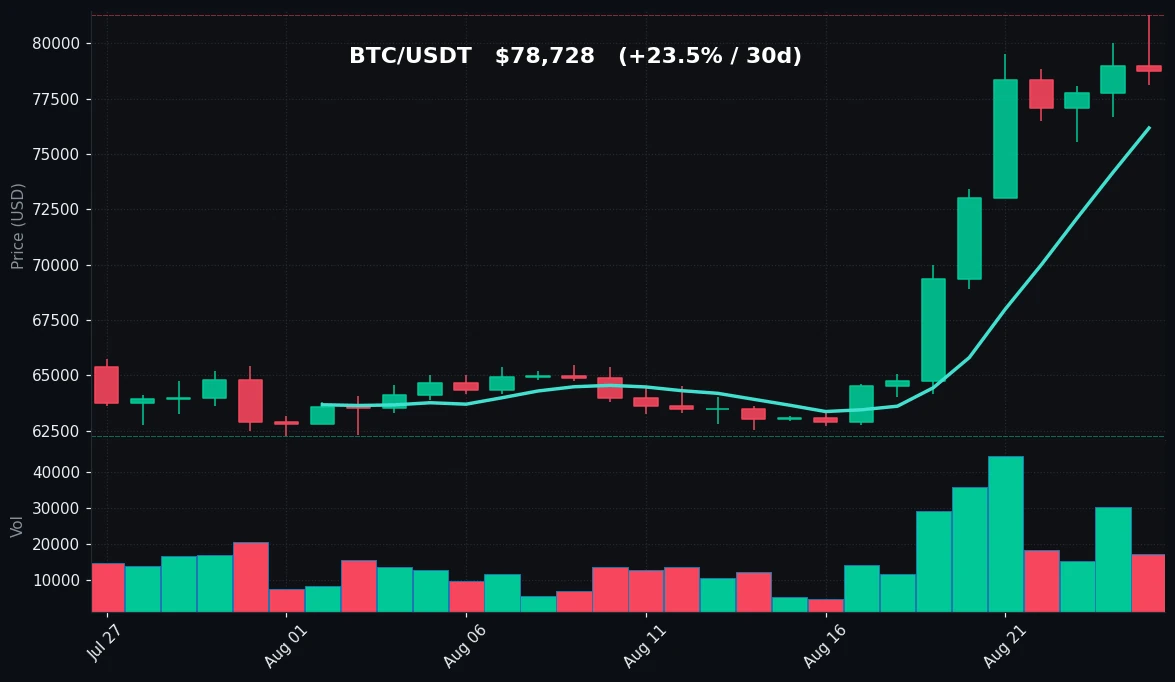
TradingView Live (4h)
Bitcoin’s price action on August 25 reflects a classic pause after a strong upward impulse. The asset is trading at $78,728, down from its 24-hour high of $81,273, but well above its 24-hour low of $78,121. The 7-day range is particularly wide — from a low of $64,166 to the recent high of $81,273 — representing a move of over 26% in just one week. Over the 30-day window, BTC has ranged from $62,275 to $81,273, demonstrating substantial volatility and a clear upward trend.
From a technical perspective, Bitcoin remains firmly above both its short-term and medium-term moving averages. The MA7 sits at $76,175, which is approximately 3.4% below the current price, while the MA30 at $66,772 is about 18% below the current level. This wide gap between price and the 30-day average highlights the velocity of the recent rally. The price action shows that BTC has consistently held above the MA7 during this run, using it as dynamic support on pullbacks.
The RSI(14) reading of 88.4 is the most critical technical signal today. This is a severely overbought condition, far exceeding the traditional 70 threshold. Historically, readings above 85 have often preceded short-term corrections or at least periods of sideways consolidation. However, in strong trending markets, RSI can remain in overbought territory for extended periods. The current reading suggests that buyer momentum is extreme, but the sustainability of this pace is questionable.
Volume analysis reveals a notable divergence. Today’s volume is only 0.66x the 7-day average, indicating that the recent price action is occurring on declining participation. This is a typical pattern during consolidation — traders are waiting for clearer signals before committing new capital. The reduced volume during the slight pullback is not necessarily bearish; it could simply mean that sellers are not aggressively taking profits. However, if volume continues to decline while price remains elevated, it may indicate weakening conviction.
The intraday pattern shows BTC attempting to reclaim the $79,000-$80,000 zone but encountering resistance near the session highs. The tight 24-hour range ($78,121-$81,273) suggests that both buyers and sellers are tentative at these levels. The proximity of the current price to the 24-hour low indicates that selling pressure is slightly more dominant in today’s session, though the magnitude remains modest.
Ethereum Analysis
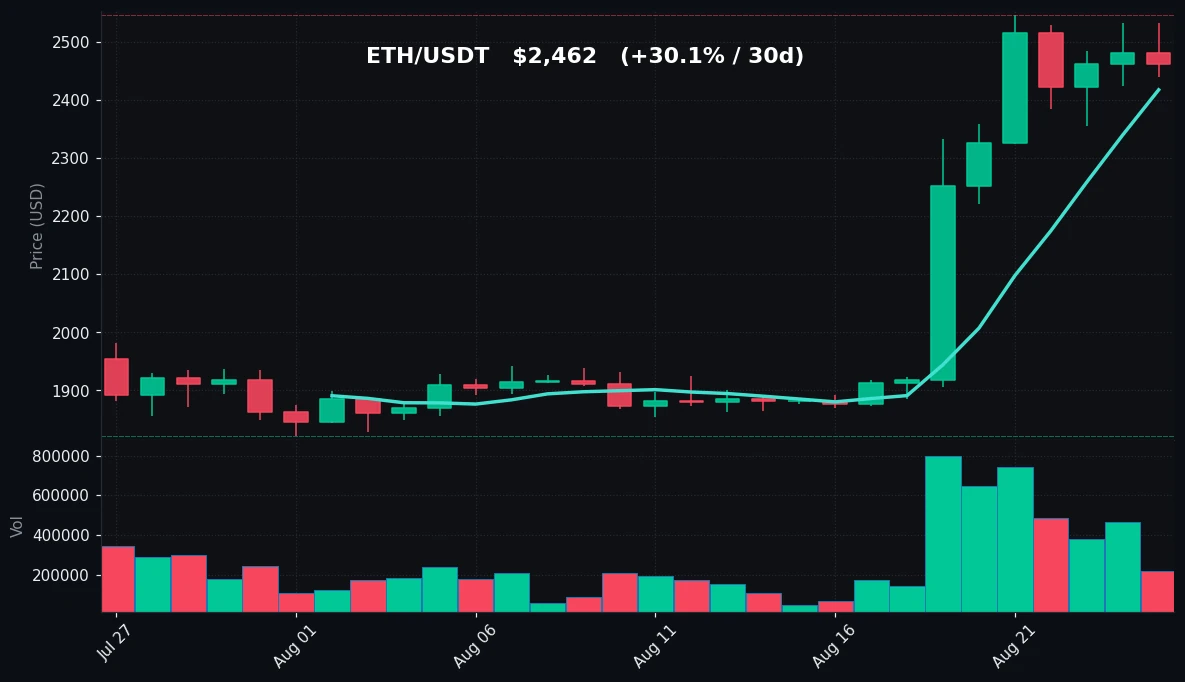
TradingView Live (4h)
Ethereum’s performance has been even more pronounced than Bitcoin’s over the past week, with a +28.40% gain that outpaced BTC’s +21.63%. However, today’s session shows ETH giving back some of those gains, trading at $2,462, down 0.80% from its previous close. The 24-hour range of $2,440 to $2,532 demonstrates a relatively contained pullback, with the price finding support near the lower boundary.
The weekly and monthly ranges for ETH tell a compelling story of aggressive accumulation. Over the past 7 days, ETH has moved from a low of $1,906 to a high of $2,547 — a 33.6% swing. The 30-day range extends from $1,822 to $2,547, showing that ETH has added roughly $725 in value over the past month. This represents a 39.8% appreciation from the monthly low, placing ETH in a strong uptrend that mirrors — and in relative terms, exceeds — Bitcoin’s recent performance.
From a moving average perspective, ETH is trading at $2,462, comfortably above its MA7 of $2,418 (a 1.8% premium) and significantly above its MA30 of $2,015 (a 22.2% premium). The MA7 has been acting as a strong support level, with ETH bouncing off this indicator during intraday dips. The widening gap between price and MA30 underscores the rapid acceleration of the trend, which historically has been followed by a period of mean reversion or at least a slowdown in momentum.
ETH’s RSI(14) reads 84.8, slightly below Bitcoin’s 88.4 but still firmly in overbought territory. This elevated reading indicates that ETH has been overbought for several sessions, and the current pullback could be viewed as a healthy correction of these extreme conditions. The fact that ETH’s RSI is slightly lower than BTC’s suggests that ETH may be slightly less overextended, though both assets face similar technical pressures.
Volume data reveals a more pronounced decline for ETH compared to BTC. Today’s volume is only 0.42x the 7-day average, indicating a substantial drop in trading activity. This is a significant signal — it suggests that the recent price appreciation was not accompanied by proportional volume, which could indicate that the rally is being driven by a relatively small number of market participants. Alternatively, it could reflect that the market is waiting for a clearer directional signal before re-engaging.
The intraday price action shows ETH struggling to maintain gains above the $2,500 psychological level, with the session high of $2,532 being rejected. The price has settled in the $2,440-$2,470 range, suggesting that traders are establishing a new equilibrium after the rapid ascent.
Key Technical Levels
| Asset | Support | Resistance | RSI |
|---|---|---|---|
| BTC | $76,175 (MA7) / $78,121 (24h low) | $81,273 (7d high) | overbought (88.4) |
| ETH | $2,418 (MA7) / $2,440 (24h low) | $2,547 (7d high) | overbought (84.8) |
BTC vs ETH Dynamic
The correlation between Bitcoin and Ethereum remains strong, with both assets moving in tandem over the past week. However, ETH has demonstrated greater relative strength, outperforming BTC by approximately 6.8 percentage points over the 7-day period (+28.40% vs +21.63%). This divergence is notable because it suggests that capital is rotating into ETH specifically, rather than simply following BTC’s lead. The 30-day figures show a similar pattern, with ETH’s +30.12% gain exceeding BTC’s +23.48%. Despite this relative outperformance, both assets are facing the same technical headwinds — extreme RSI readings and declining volume. The correlation between their 24-hour performance (-0.34% vs -0.80%) indicates that selling pressure is slightly more intense on ETH, which could be a sign of profit-taking in the relatively stronger performer. The overall market structure suggests that traders are treating both assets as part of a broader risk-on crypto trade, with the primary differentiator being beta — ETH is acting as the higher-beta play.
Strategy Fit
The current market conditions — characterized by extreme RSI readings, declining volume, and wide price ranges — present a unique challenge for traders. The volatility experienced over the past week (BTC swinging from $64,166 to $81,273, ETH from $1,906 to $2,547) creates opportunities but also significant risk.
For traders using Pionex’s built-in bots, several strategies warrant consideration. The Grid Trading Bot is particularly well-suited for the current consolidation phase. With BTC oscillating between $78,121 and $81,273, a grid strategy that buys at support and sells at resistance can capture profits from the expected range-bound movement without requiring directional conviction. The key is to set grid boundaries that encompass the recent trading range while leaving room for potential breakouts.
The DCA (Dollar-Cost Averaging) Bot offers a more conservative approach for traders who believe in the long-term trend but are wary of entering at current levels. By setting up a DCA strategy with a defined budget, traders can accumulate positions at various price points, averaging out their entry price over time. Given the extreme RSI readings, a DCA approach helps mitigate the risk of buying at a local top.
For trend-following strategies, the Trailing Take-Profit Bot could be appropriate. This bot allows traders to ride the trend while automatically locking in profits as the price moves in their favor. Given the strong upward momentum of the past week, this strategy could capture additional upside while protecting against sudden reversals.
It is important to note that the current volume conditions (0.66x and 0.42x of 7-day averages) suggest that the market is in a wait-and-see mode. Strategies that require high liquidity, such as large-scale arbitrage, may be less effective. Grid trading and DCA are better suited to these conditions as they do not rely on high volume to generate returns.
Traders should also consider the risk of a sharp reversal given the extreme RSI levels. A sudden move back toward the MA7 levels ($76,175 for BTC, $2,418 for ETH) would represent a 3.4% and 1.8% decline respectively — manageable for grid strategies but potentially painful for leveraged positions.
Risk Disclaimer
This market recap is provided for informational and educational purposes only and does not constitute financial advice, investment advice, trading advice, or any other advice. Cryptocurrency markets are highly volatile and involve substantial risk of loss. Past performance is not indicative of future results. The data presented in this recap is based on publicly available information and is believed to be accurate as of the date of publication, but no guarantee is made regarding its accuracy or completeness. You should consult with a qualified financial advisor before making any investment decisions. Trading in cryptocurrencies can lead to partial or total loss of your invested capital. Never invest money that you cannot afford to lose. The strategies mentioned, including grid trading, DCA, and trailing take-profit, carry their own risks and may not be suitable for all investors. You are solely responsible for your own investment decisions and should conduct thorough research before engaging in any trading activity.
FAQ
Q1: Why is Bitcoin's RSI above 88 if the price is down today?
RSI (Relative Strength Index) is a momentum indicator that measures the magnitude of recent price changes. It is calculated based on the average gains and losses over a specified period (14 periods by default). Because Bitcoin has experienced such a strong rally over the past week (+21.63%), the average gains far exceed the average losses, keeping the RSI elevated even when the daily price shows a small decline. A single day of minor losses does not significantly impact the RSI calculation, especially when compared to the substantial gains of the preceding days.
Q2: What does the declining volume indicate?
The volume metrics (BTC at 0.66x and ETH at 0.42x of their 7-day averages) indicate that trading activity has decreased compared to recent averages. This typically suggests that market participants are less active, possibly waiting for clearer signals. In the context of a strong rally, declining volume can indicate that the buying pressure is waning, which may lead to consolidation or a pullback. However, it can also simply reflect a normal pause in trading activity after a period of intense volatility.
Q3: How should I interpret the MA7 and MA30 levels?
The Moving Average 7 (MA7) is a short-term trend indicator that reflects the average price over the last 7 days. The Moving Average 30 (MA30) is a medium-term indicator reflecting the average price over the last 30 days. When the price is above both MAs, it indicates an uptrend. The distance between the price and the MAs can indicate how overextended the market is. Currently, BTC is 3.4% above MA7 and 18% above MA30, while ETH is 1.8% above MA7 and 22.2% above MA30. These gaps suggest that the recent rally has been rapid and may be due for a period of consolidation.
Q4: Is it common for RSI to stay above 80 for multiple days?
Yes, in strong trending markets, RSI can remain in overbought territory (above 70) for extended periods. This is often referred to as "overbought conditions persisting" or "trending overbought." In a strong uptrend, RSI readings above 80 can last for several days or even weeks. However, the longer the RSI stays at extreme levels, the higher the probability of a correction. Traders should not interpret an overbought RSI as an immediate sell signal, but rather as a warning that the trend may be maturing.
Q5: What is the significance of the 24-hour high and low?
The 24-hour high and low represent the highest and lowest prices traded during the last 24 hours. These levels are often watched by traders as potential support (low) and resistance (high) levels for short-term trading. For BTC, the 24-hour range is $78,121 to $81,273. A break above the high could signal continued momentum, while a break below the low might indicate a shift in sentiment. These levels are particularly relevant in a low-volume environment where price movements can be more erratic.


