BTC ETH Daily Recap — 2026-08-26

BTC ETH Daily Recap — 2026-08-26
Today at a Glance
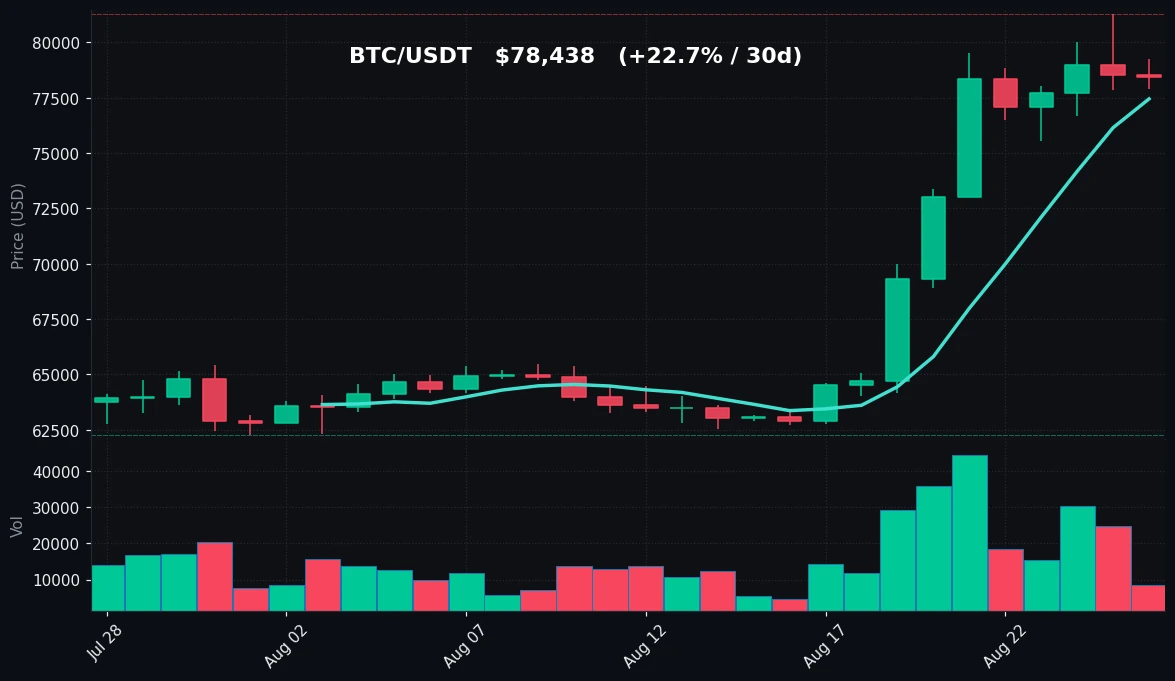
Bitcoin (BTC) is trading at $78,438, down a marginal -0.13% over the past 24 hours, with an intraday range between $79,252 and $77,913. Despite the slight daily pullback, BTC remains firmly in a bullish posture on higher timeframes: +13.13% over the last seven days and +22.72% over the past 30 days. The asset is currently holding above both the 7-day moving average ($77,449) and the 30-day moving average ($67,256), indicating sustained upward momentum. However, the Relative Strength Index (RSI) at 87.7 signals extreme overbought conditions, and trading volume has dropped to 0.3x the 7-day average, suggesting a consolidation phase.
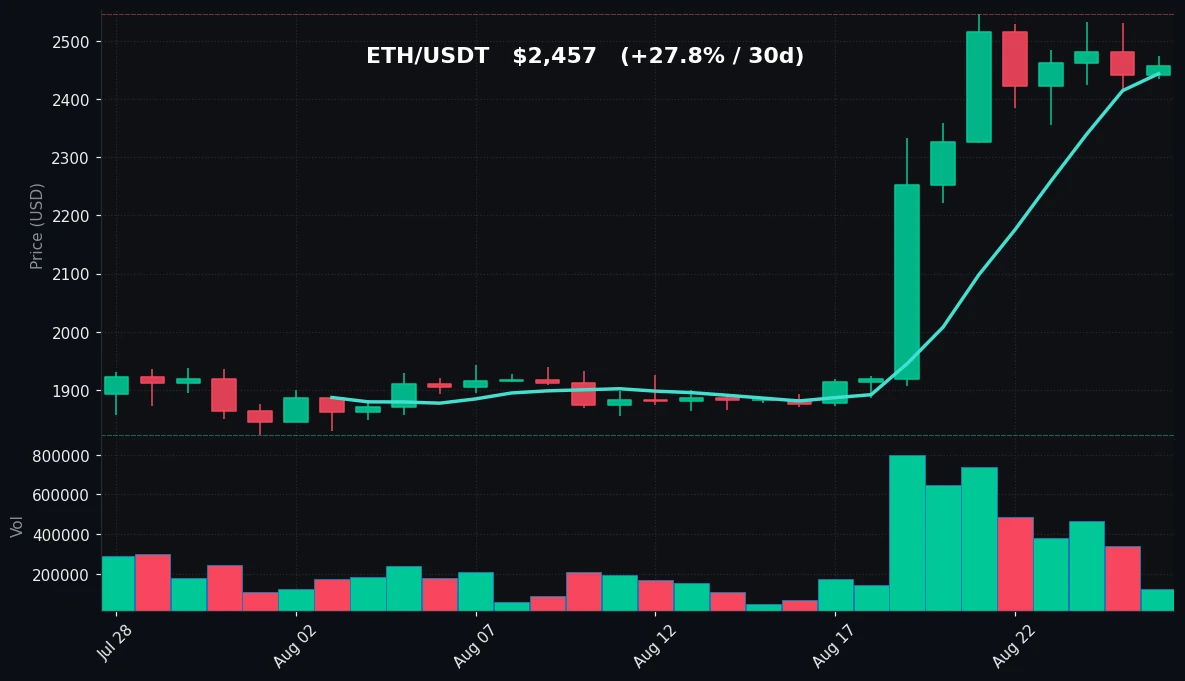
Ethereum (ETH) is trading at $2,457, up +0.58% in the last 24 hours, with a tight range of $2,476 high and $2,436 low. ETH has gained +9.06% over the past week and +27.81% over the past month. Its MA7 sits at $2,444 and MA30 at $2,033, both below the current price. RSI for ETH is 83.4, also in overbought territory. Volume is notably thin at 0.22x the 7-day average, indicating low participation during this consolidation. Both assets are pausing after strong rallies, with price action contained near recent highs.
Bitcoin Analysis
TradingView Live (4h)
Trend Structure
Bitcoin's current price of $78,438 sits comfortably above both its short-term and medium-term moving averages. The MA7 at $77,449 is acting as immediate dynamic support, while the MA30 at $67,256 is well below the market, reflecting the strength of the recent rally. The 7-day high of $81,273 and 7-day low of $68,902 illustrate the volatility experienced over the past week — a swing of more than $12,000. The 30-day range is even wider: from a low of $62,275 to the same high of $81,273, representing a massive +30% move from the monthly low.
Key Technical Levels
The immediate resistance zone is the recent swing high at $81,273. This level was tested and rejected within the last 7 days, and a break above it would open the path toward uncharted territory. On the downside, the first support is the MA7 at $77,449, followed by the psychological $75,000 level, and then the $70,000 round number. A deeper correction would target the 30-day MA at $67,256, which has not been revisited since the rally began.
Volume and Momentum
Volume is a critical concern here. Current volume is at 0.3x the 7-day average — a significant drop. This suggests that the recent rally has not been accompanied by strong participation at these levels. Low volume during a price consolidation near highs can indicate either a healthy pause or a potential distribution phase. Without volume confirmation, the sustainability of the current price level is uncertain. The RSI at 87.7 is deeply overbought — readings above 70 are traditionally considered overbought, and 87.7 is an extreme reading. Historically, such RSI levels have often preceded short-term pullbacks or at least prolonged sideways consolidation as buyers exhaust themselves.
Price Action Assessment
The current daily candle shows a marginal decline, which is consistent with a market taking a breather after a strong upward move. The intraday range of $1,339 is relatively narrow compared to the 7-day range, suggesting reduced volatility. The price is holding above the MA7, which is a positive sign for the short-term trend. However, the combination of extreme RSI, declining volume, and proximity to a recent high creates a fragile balance. The market appears to be waiting for a catalyst — either a breakout above $81,273 on strong volume or a pullback toward the MA7 to reset the overbought condition.
No Directional Bias
It is important to note that these observations do not constitute a prediction. The market could resolve in either direction. An overbought RSI can stay overbought for extended periods in strong trends. Low volume can precede both breakouts and breakdowns. The data simply describes a market that is extended, consolidating, and awaiting fresh input.
Ethereum Analysis
TradingView Live (4h)
Trend Structure
Ethereum is trading at $2,457, showing relative strength with a +0.58% gain in the last 24 hours despite the broader market's slight weakness. ETH's price is above both its MA7 ($2,444) and MA30 ($2,033), maintaining a bullish structure. The 7-day range spans from $2,222 to $2,547, a $325 swing, while the 30-day range is much wider: from $1,822 to $2,547, representing a gain of nearly 40% from the monthly low. ETH has outperformed BTC over the 30-day period (+27.81% vs +22.72%), suggesting a shift in capital flows toward the second-largest cryptocurrency.
Key Technical Levels
The immediate resistance is the 7-day high at $2,547. This level has been tested but not yet broken on a closing basis. Above that, the $2,600 and $2,700 levels would be next psychological barriers. On the downside, the first support is the MA7 at $2,444, which is very close to the current price — only $13 below. This makes the MA7 a critical level to watch in the short term. A break below it would expose the $2,300 area, followed by the $2,222 weekly low. The MA30 at $2,033 represents a major support zone, but it would require a significant correction to be reached.
Volume and Momentum
ETH's volume situation is even more extreme than BTC's. At 0.22x the 7-day average, trading activity has dried up considerably. This is typical of a consolidation phase, but it also means that any significant move — up or down — could be amplified due to thin liquidity. The RSI at 83.4 is overbought, though slightly less extreme than BTC's 87.7. This suggests that ETH has slightly less momentum exhaustion than BTC, but it is still firmly in overbought territory.
Price Action Assessment
ETH's daily candle is green, showing resilience in the face of BTC's slight decline. The intraday range is extremely tight at just $40, indicating that the market is coiled. The proximity of the price to the MA7 ($2,444) and the 7-day high ($2,547) creates a clear technical setup: the price is sandwiched between support and resistance in a narrowing range. This type of price action often precedes a breakout, though the direction is not predetermined by the data.
Relative Performance
ETH's 24h performance of +0.58% versus BTC's -0.13% is notable. This divergence could indicate that traders are rotating from BTC into ETH, or that ETH is simply catching up after underperforming in the earlier stages of the rally. The 30-day performance gap (ETH +27.81% vs BTC +22.72%) supports the idea that ETH is in a catch-up phase. However, it is also possible that ETH is more resilient to selling pressure due to lower volume and less active profit-taking.
No Directional Bias
As with BTC, this is a data description, not a forecast. The narrow range, low volume, and overbought RSI present a market that is undecided. The outcome — whether a breakout above $2,547 or a pullback toward $2,300 — will depend on external factors such as macroeconomic news, regulatory developments, or shifts in broader risk sentiment. The technical picture alone does not provide a clear directional signal.
Key Technical Levels
| Asset | Support | Resistance | RSI |
|---|---|---|---|
| BTC | $77,449 (MA7) / $75,000 | $81,273 (7d High) | Overbought (87.7) |
| ETH | $2,444 (MA7) / $2,300 | $2,547 (7d High) | Overbought (83.4) |
BTC vs ETH Dynamic
The correlation between BTC and ETH remains strong, as is typical in the crypto market. Both assets are in overbought territory, both are consolidating below their 7-day highs, and both are experiencing significantly reduced trading volume. However, there are subtle divergences worth noting. ETH's 24-hour performance is positive while BTC's is slightly negative, suggesting some capital rotation. Over the 30-day period, ETH has outperformed BTC by roughly 5 percentage points, indicating that the ETH/BTC ratio has been trending upward. This could reflect a market that is becoming more comfortable with risk, as ETH is generally considered a higher-beta asset than BTC. The volume profile also differs — ETH's volume is at 0.22x the 7-day average while BTC's is at 0.3x, meaning ETH's liquidity has dried up more significantly. In a low-liquidity environment, ETH could experience sharper moves in either direction when volatility returns. The overall dynamic is one of a market that has rallied hard, is now pausing, and is awaiting fresh direction. The relationship between the two assets remains constructive, with neither showing signs of a breakdown in relative strength.
Strategy Fit
Given the current market conditions — strong uptrend, extreme overbought RSI, and significantly reduced volume — the environment favors certain trading strategies over others.
Grid Trading is particularly well-suited for this consolidation phase. With BTC range-bound between approximately $77,400 and $81,300, and ETH between $2,440 and $2,550, a grid bot can profit from the oscillation within these ranges. The reduced volatility means that grid levels are less likely to be blown through, allowing the bot to accumulate small profits on each fill. Pionex offers built-in grid trading bots that can be configured with custom upper and lower bounds, making it straightforward to set up a range-bound strategy around the current support and resistance levels.
DCA (Dollar-Cost Averaging) is also relevant, though it requires a different approach. Given the overbought conditions, a simple DCA strategy that buys at regular intervals would be averaging into a potentially extended market. However, a DCA bot with a price-based trigger — such as buying only on dips of 3-5% — could be more appropriate. Pionex's DCA bots allow for this kind of conditional buying, which aligns well with the current environment where a pullback toward the MA7 levels is a plausible scenario.
Trend Following is the most challenging strategy in the current environment. The trend is clearly up, but the extreme RSI readings suggest that the trend is mature. Entering a new trend-following position at these levels carries increased risk of a short-term reversal. For traders already in trend positions, trailing stops or partial profit-taking could be considered to lock in gains.
The key takeaway is that the current market favors mean-reversion strategies (grid) or conditional accumulation (dip-buying DCA) over aggressive trend-chasing. The low volume environment also suggests that position sizes should be managed carefully, as liquidity is thin.
Risk Disclaimer
This market recap is for informational and educational purposes only and does not constitute financial advice, investment advice, trading advice, or any other type of professional advice. Cryptocurrency markets are highly volatile and involve substantial risk of loss. Past performance is not indicative of future results. The data presented herein is based on publicly available information and is believed to be accurate but is not guaranteed. You should consult with a qualified financial advisor before making any investment decisions. Never invest money that you cannot afford to lose. Trading bots and automated strategies do not eliminate risk and can result in significant losses. The author and publisher of this content are not liable for any losses or damages arising from the use of this information.
FAQ
Q1: Why is Bitcoin's RSI above 87 but the price is only slightly down today?
RSI measures the magnitude of recent price changes to evaluate overbought or oversold conditions. A reading of 87.7 indicates that gains over the lookback period (typically 14 periods) have been very strong relative to losses. The current daily price decline of -0.13% is minimal and does not significantly alter the RSI calculation because the RSI is based on a longer window of price action. The RSI reflects the accumulated momentum over the past two weeks, not just today's move.
Q2: What does the low volume (0.3x for BTC and 0.22x for ETH) indicate?
Low volume relative to the 7-day average indicates reduced trading participation. This can mean that the market is in a consolidation phase, with fewer active buyers and sellers. Low volume near price highs can be interpreted in two ways: either sellers are not aggressive enough to push prices down, or buyers are not confident enough to push prices higher. It often precedes a volatility expansion, but the direction of that expansion is not predetermined.
Q3: What is the significance of the 7-day high at $81,273 for BTC?
The 7-day high represents the highest price traded over the last seven days. It acts as a resistance level because traders who bought near that price may be looking to sell and break even. A break above this level on strong volume could signal a continuation of the uptrend. Conversely, a rejection at this level could lead to a pullback toward support levels like the MA7 at $77,449.
Q4: How does Ethereum's current situation compare to Bitcoin's?
ETH is in a similar technical position to BTC: above its moving averages, overbought RSI, and experiencing low volume. However, ETH has shown relative strength today with a positive 24h change while BTC is slightly negative. ETH has also outperformed BTC over the 30-day period. The key difference is the magnitude of the RSI reading (83.4 vs 87.7) and the level of volume reduction (0.22x vs 0.3x).
Q5: Is this a good time to use a grid trading bot on Pionex?
Grid trading bots are designed to profit from range-bound markets. Given that both BTC and ETH are consolidating within identifiable ranges (approximately $77,400-$81,300 for BTC and $2,440-$2,550 for ETH), a grid bot could potentially capture profits from the oscillation. However, it is important to set appropriate upper and lower bounds based on the current support and resistance levels. If the price breaks out of the range, the grid bot may miss further upside or accumulate losses on one side of the grid. Grid trading is not without risk, and the low volume environment could lead to wider spreads and less predictable fills.


