BTC ETH Daily Recap — 2026-08-03

BTC ETH Daily Recap — 2026-08-03
Today at a Glance
Bitcoin and Ethereum both closed the trading session in mildly negative territory, with BTC sliding 0.59% to $63,192 and ETH losing 1.62% to $1,855. The intraday ranges were relatively tight—BTC oscillated between $62,300 and $63,596, while ETH traded between $1,829 and $1,886. Both assets remain within their respective 30-day bands, with BTC sitting near the lower half of its range and ETH showing a positive 30-day return of +3.87% versus BTC's -0.72%. Volume has contracted sharply for both assets, at 0.55x and 0.45x of their 7-day averages respectively, suggesting a consolidation phase. RSI readings of 40.4 (BTC) and 44.5 (ETH) indicate neither asset is stretched, leaving room for movement in either direction without immediate overbought or oversold signals.
Bitcoin Analysis
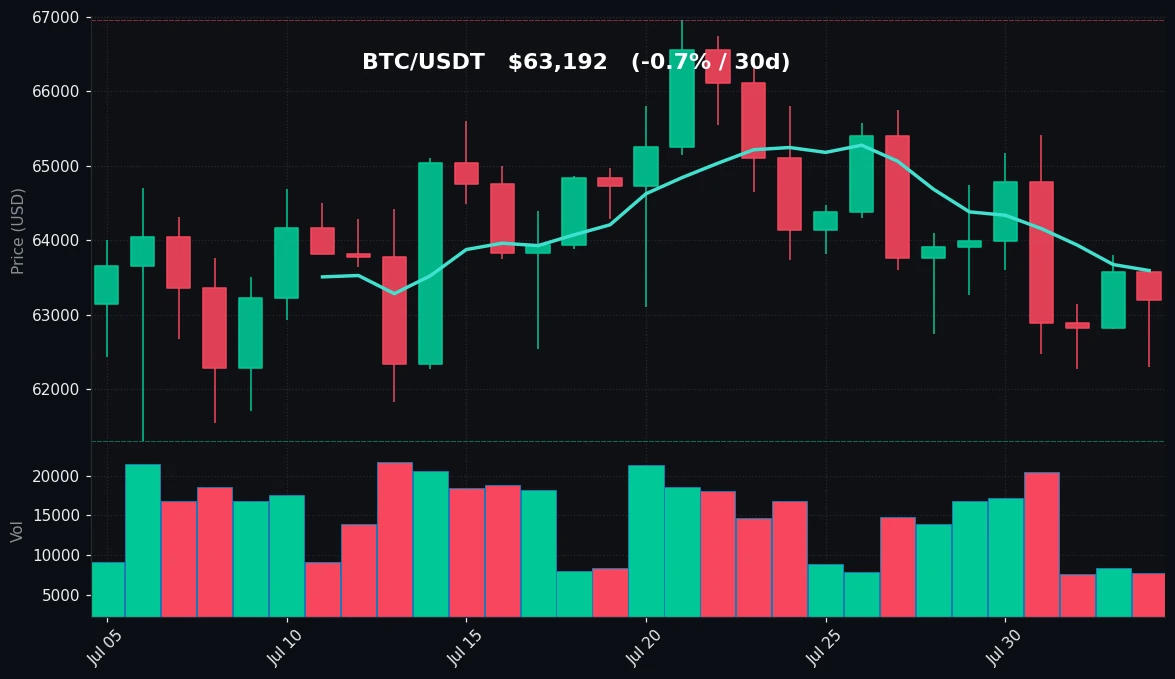
TradingView Live (4h)
Bitcoin's price action over the past 24 hours has been characterized by low volatility and declining participation. The asset opened near $63,500, briefly touched a daily high of $63,596, then drifted lower to a session low of $62,300 before settling at $63,192. This places BTC below its 7-day moving average of $63,593 and below the 30-day MA of $64,121, confirming a short-term bearish tilt within a broader consolidation.
The 7-day trajectory shows a modest decline of -0.88%, with a weekly high of $65,410 and a low of $62,275. The 30-day picture is similarly flat at -0.72%, with a range spanning $61,307 to $66,956. Notably, BTC has failed to reclaim the $64,000–$65,000 zone over the past week, and each rally attempt has been met with selling pressure near the 7-day MA.
Volume is the most telling metric today. At 0.55x the 7-day average, participation has dried up considerably, which explains the narrow intraday band. Low volume typically precedes a volatility expansion, but the direction remains unresolved. RSI(14) at 40.4 sits in neutral-to-weak territory, below the 50 midpoint but well above the 30 oversold threshold. This suggests sellers are in control but lack momentum to push prices significantly lower without fresh catalysts.
Key technical levels to monitor: immediate support rests at the 7-day low of $62,275, with stronger support at the 30-day low of $61,307. On the upside, resistance is at the 7-day MA of $63,593, followed by the psychological $65,000 level and the 30-day high of $66,956. The asset has been range-bound for 30 days, and today's session does not indicate a breakout attempt.
Ethereum Analysis
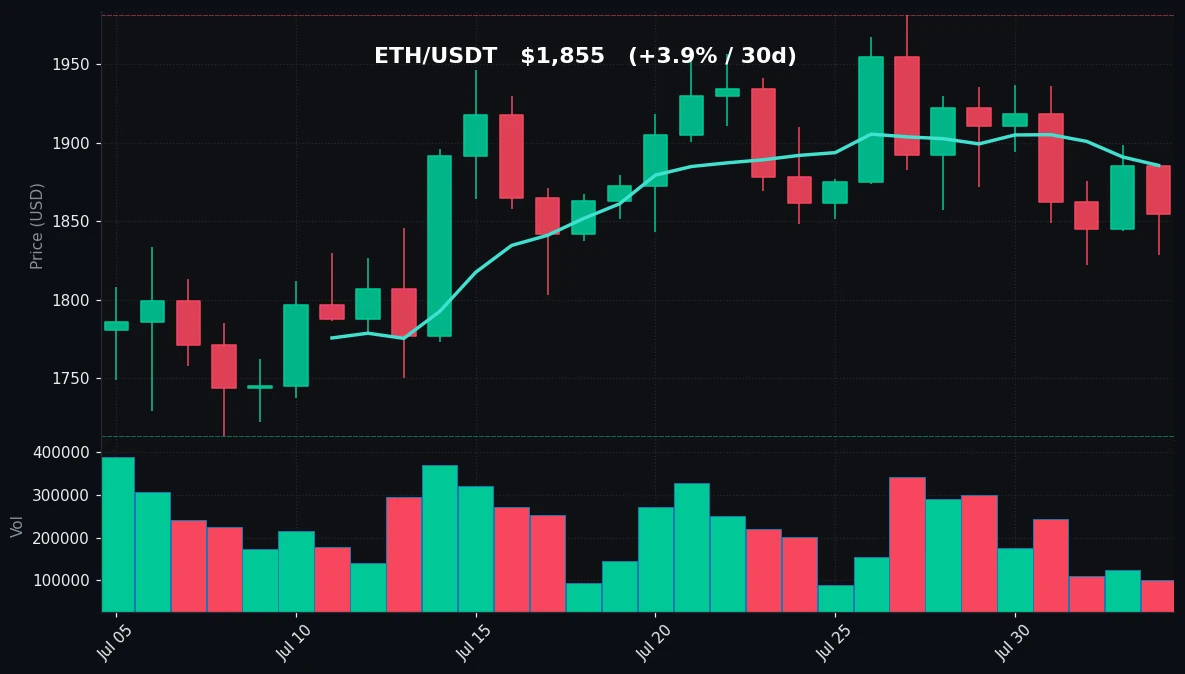
TradingView Live (4h)
Ethereum underperformed Bitcoin on a relative basis today, declining 1.62% versus BTC's 0.59% drop. ETH closed at $1,855, having traded between a high of $1,886 and a low of $1,829. The asset sits below its 7-day moving average of $1,886 but marginally above the 30-day MA of $1,856, indicating a mixed technical posture.
Over the past week, ETH has shed 1.99%, with a high of $1,937 and a low of $1,822. The 30-day performance, however, remains positive at +3.87%, with a range of $1,713 to $1,981. This contrast highlights that ETH has been building a higher base over the past month, even as short-term momentum has cooled.
Volume is particularly weak today at 0.45x the 7-day average, even more subdued than Bitcoin's reading. This suggests that the recent decline is not driven by aggressive selling but rather by an absence of buyers. RSI(14) at 44.5 is slightly more constructive than BTC's 40.4, but still below the neutral 50 level. ETH has not shown oversold conditions, leaving room for further downside before value buyers might step in.
Technical levels to watch: immediate support is at the 7-day low of $1,822, with the 30-day low of $1,713 as a secondary floor. Resistance sits at the 7-day MA of $1,886, followed by the 30-day high of $1,981. The proximity of the current price to the 30-day MA suggests that a sustained break below $1,856 could shift the medium-term structure bearish, while a reclaim of $1,886 would signal renewed short-term strength.
Key Technical Levels
| Asset | Support | Resistance | RSI |
|---|---|---|---|
| BTC | $62,275 (7d low) / $61,307 (30d low) | $63,593 (MA7) / $65,410 (7d high) / $66,956 (30d high) | 40.4 — neutral, leaning bearish |
| ETH | $1,822 (7d low) / $1,713 (30d low) | $1,886 (MA7) / $1,937 (7d high) / $1,981 (30d high) | 44.5 — neutral |
BTC vs ETH Dynamic
The correlation between Bitcoin and Ethereum remains high, as evidenced by both assets moving in the same direction today and over the past week. However, the magnitude of the moves differs: ETH's 24-hour decline of 1.62% is nearly three times BTC's 0.59% drop, reflecting ETH's higher beta characteristics. Over the past 30 days, this relationship has diverged—ETH is up 3.87% while BTC is down 0.72%—suggesting that ETH has been the relative outperformer during this consolidation phase. Volume dynamics also differ, with ETH's activity contracting more sharply than BTC's, indicating that the recent ETH price action is more susceptible to thin liquidity conditions. The relative strength of ETH's 30-day trend versus BTC's flat profile may attract rotation into ETH if the broader market stabilizes, but today's session shows no evidence of such rotation occurring.
Strategy Fit
Given the current market conditions—low volatility, declining volume, and neutral RSI readings for both BTC and ETH—the environment is not ideal for trend-following strategies. Neither asset is exhibiting a clear directional bias, and the lack of volume reduces the reliability of breakout signals. For traders seeking to engage with the market, a grid trading strategy appears most appropriate. The established ranges—BTC between $62,275 and $65,410, ETH between $1,822 and $1,937—provide defined boundaries within which a grid bot can systematically buy low and sell high. Pionex's built-in grid trading bots are well-suited for this type of range-bound market, as they automate the process of placing limit orders across the price spectrum, capturing small profits on each oscillation without requiring constant manual oversight.
For more conservative participants, a DCA (Dollar-Cost Averaging) approach may be preferable, particularly given the absence of a clear trend. Accumulating positions at regular intervals during this consolidation phase can lower the average entry price over time, positioning for a potential future breakout. Trend-following strategies, by contrast, should be avoided until either BTC reclaims $65,000 or ETH breaks above $1,937 with volume confirmation. The current volatility levels, as measured by the narrow daily ranges, do not support momentum-based approaches.
Risk Disclaimer
This market recap is provided for informational and educational purposes only and does not constitute financial advice, investment advice, trading advice, or any other form of professional advice. Cryptocurrency markets are highly volatile and involve substantial risk of loss. Past performance is not indicative of future results. You should not make any investment decisions based solely on the information contained in this document. Always conduct your own research and consult with a qualified financial advisor before making any investment decisions. The author and publisher of this recap are not responsible for any losses or damages that may arise from the use of this information. Trading cryptocurrencies involves risk, and you should only trade with capital you can afford to lose.
FAQ
Q1: Why is Bitcoin's RSI at 40.4 but the price hasn't dropped more?
An RSI of 40.4 indicates bearish momentum but not oversold conditions (which typically begin below 30). The price is being held up by the 30-day range low of $61,307, which has acted as a floor. Low volume (0.55x average) means there is little selling pressure to push prices through that support level.
Q2: Ethereum is down more than Bitcoin today—is this a trend?
ETH has shown higher beta characteristics, meaning it tends to move more than BTC in both directions. However, over the past 30 days, ETH is actually up 3.87% while BTC is down 0.72%, so today's underperformance is not indicative of a longer-term trend.
Q3: What does the volume contraction (0.55x and 0.45x) mean for traders?
Volume contraction typically signals a lack of conviction among market participants. It often precedes a volatility expansion, but the direction of the move is uncertain. For traders, this means tighter stops and smaller position sizes may be prudent until volume returns.
Q4: Are the 30-day highs and lows reliable support and resistance levels?
The 30-day high and low represent the extremes of the recent trading range and have been tested multiple times. They serve as significant technical levels because they mark prices where buyers or sellers have previously stepped in with enough force to reverse the trend. However, no level is guaranteed to hold.
Q5: How should I interpret the difference between the 7-day and 30-day moving averages?
The 7-day MA reflects short-term momentum, while the 30-day MA indicates the medium-term trend. BTC is below both (bearish alignment), while ETH is below its 7-day MA but above its 30-day MA (mixed). When the 7-day MA crosses below the 30-day MA, it is often considered a bearish signal, and vice versa.


