BTC ETH Daily Recap — 2026-08-28

BTC ETH Daily Recap — 2026-08-28
Today at a Glance
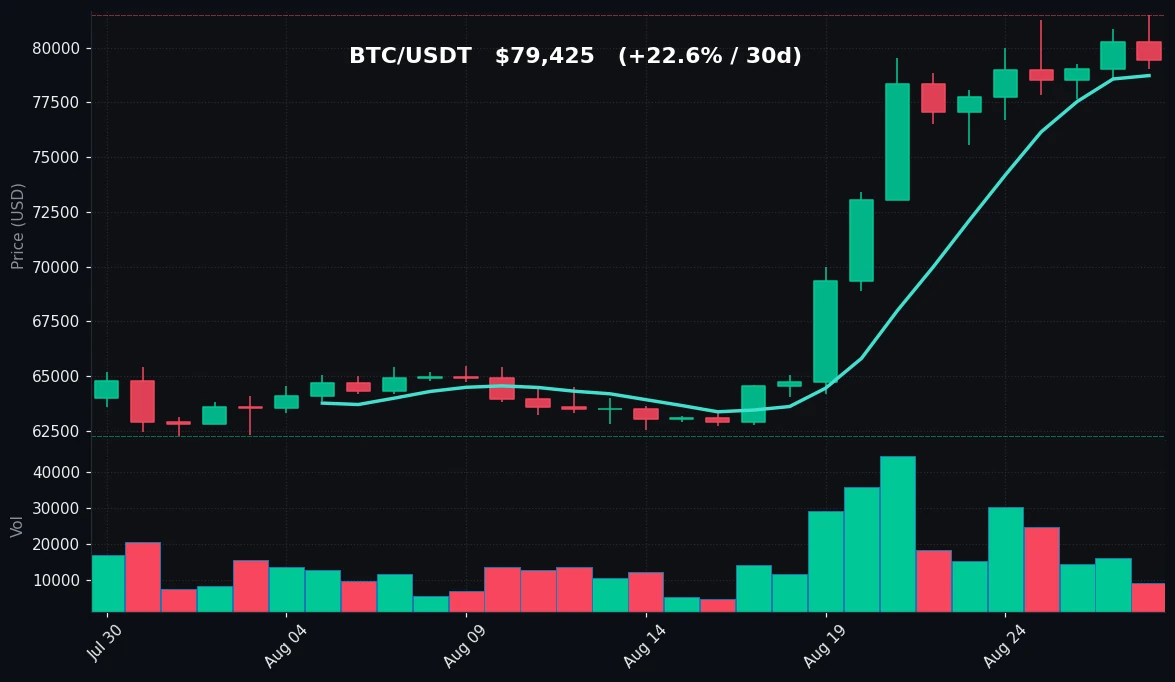
Bitcoin (BTC) is trading at $79,425, down 1.03% over the past 24 hours, after tapping a daily high of $81,479 and a low of $79,001. Despite the short-term pullback, BTC remains up 1.39% over the past week and a robust 22.61% over the past 30 days. The asset is trading above both its 7-day moving average ($78,720) and its 30-day moving average ($68,334), indicating a strong medium-term uptrend. However, the RSI(14) sits at an elevated 87.5, signaling overbought conditions. Volume is notably thin at 0.4x the 7-day average, suggesting the recent price action is driven by low participation.
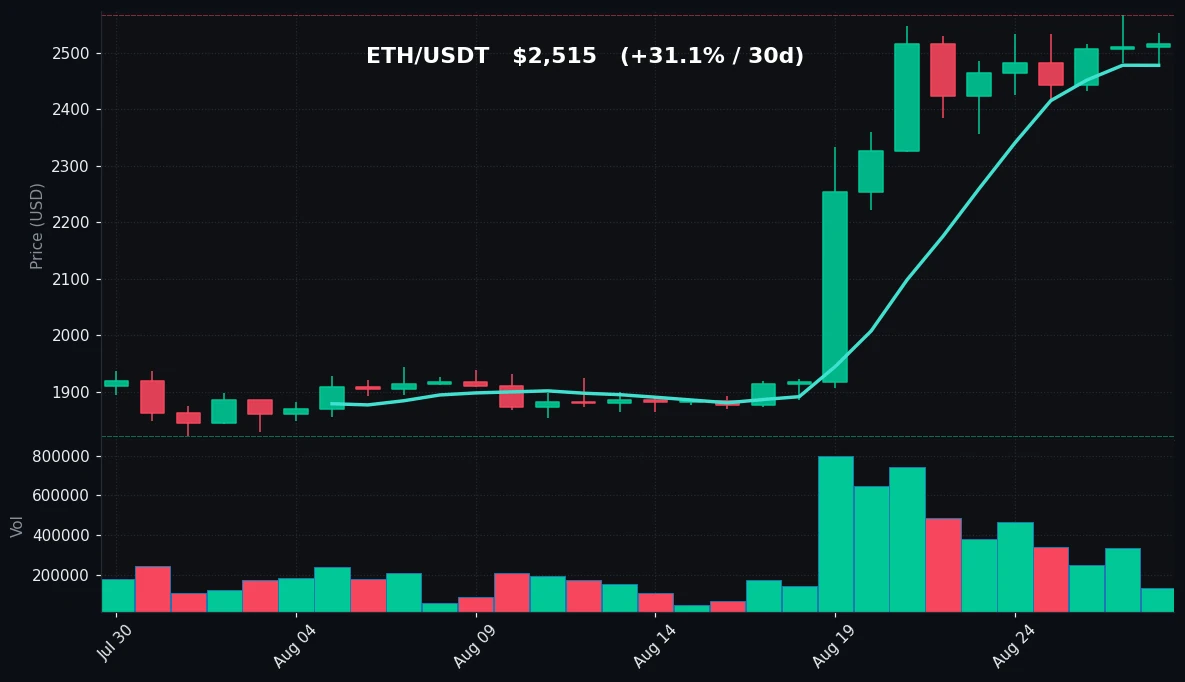
Ethereum (ETH) is trading at $2,515, up a marginal 0.16% in the last 24 hours, with a daily range of $2,477 to $2,535. Over the past week, ETH is nearly flat (-0.05%), but over the past 30 days, it has surged 31.11%, outperforming BTC on that timeframe. ETH is also above its MA7 ($2,478) and MA30 ($2,074). Its RSI(14) is 84.7, also in overbought territory. Volume is similarly depressed at 0.31x the 7-day average. Both assets are consolidating near recent highs on thin liquidity, a pattern that warrants close observation.
Bitcoin Analysis
TradingView Live (4h)
Bitcoin's price action over the past 24 hours reflects a modest pullback from the immediate resistance zone near $81,479, which also marks the 7-day and 30-day high. The intraday low of $79,001 was defended, and BTC has settled around $79,425, holding above the 7-day moving average of $78,720. This level is acting as immediate dynamic support; a break below it would expose the next support cluster near $75,546, the 7-day low.
The broader trend remains decisively bullish. Over the past 30 days, BTC has rallied from a low of $62,275 to its current price, a move of approximately 27.5% from the cycle low. The 30-day moving average at $68,334 is well below the current price, confirming a strong upward slope. The price is also holding above the 7-day MA, which has been a reliable trend filter during this rally.
However, technical indicators are flashing caution. The RSI(14) at 87.5 is deep into overbought territory (above 70). Historically, such readings have preceded short-term consolidation or pullbacks, though they do not necessarily signal a trend reversal. In a strong uptrend, RSI can remain overbought for extended periods. The key context here is volume: current volume is only 0.4x the 7-day average. This suggests that the recent push to $81,479 was not accompanied by significant buying pressure, and the current pullback is also occurring on low volume. This low-participation environment can lead to sharp, erratic moves in either direction.
Key technical levels to monitor are the $81,479 resistance (recent high) and the $78,720 support (MA7). A sustained break above the resistance on higher volume would confirm trend continuation, while a loss of the MA7 support could trigger a test of the $75,546 area. The RSI remains a critical watch item; any divergence between price and RSI would be a notable technical development. The current setup is one of a strong uptrend pausing on thin volume, with overbought conditions limiting immediate upside potential without a consolidation phase.
Ethereum Analysis
TradingView Live (4h)
Ethereum is trading at $2,515, essentially flat over the last 24 hours (+0.16%), with a tight intraday range between $2,477 and $2,535. The price is hovering just above its 7-day moving average of $2,478, which is acting as immediate support. The 7-day high of $2,567 represents the immediate resistance level; ETH has been unable to close above this level since the recent rally.
Looking at the broader picture, ETH's 30-day performance is notable: a 31.11% gain, moving from a low of $1,822 to the current price. This represents a significant recovery and places ETH's 30-day momentum ahead of BTC's. The 30-day moving average at $2,074 is well below the current price, confirming a strong medium-term uptrend. The price structure shows higher lows and higher highs over the past month, a classic bullish pattern.
The RSI(14) at 84.7 is in overbought territory, similar to BTC. This reading suggests that the recent price increase has been rapid and that the asset is technically stretched. However, as with BTC, overbought conditions in a strong trend can persist. The volume situation is even more pronounced for ETH: current volume is 0.31x the 7-day average, indicating very low participation. This low volume environment means that the current price levels are not being tested by significant buying or selling pressure, which can lead to sudden volatility.
The key support level is the MA7 at $2,478, followed by the $2,356 area (7-day low). Resistance is clearly defined at $2,567. A break above this level on increased volume would signal a continuation of the uptrend, targeting new local highs. Conversely, a break below the MA7 support would likely lead to a test of the $2,356 support. The RSI divergence, if any, will be a key signal to watch. ETH's current position—just above support and below resistance, with low volume and overbought RSI—suggests a period of indecision. The market is waiting for a volume catalyst to determine the next directional move.
Key Technical Levels
| Asset | Support | Resistance | RSI |
|---|---|---|---|
| BTC | $78,720 (MA7) / $75,546 | $81,479 | Overbought (87.5) |
| ETH | $2,478 (MA7) / $2,356 | $2,567 | Overbought (84.7) |
Note: Support and resistance levels are derived from recent price action and moving averages. RSI status is based on the 14-period RSI, with values above 70 considered overbought.
BTC vs ETH Dynamic
The correlation between BTC and ETH remains high, as is typical in the crypto market. Both assets are trading in similar technical setups: above their respective 7-day and 30-day moving averages, with RSI in overbought territory and volume well below average. However, there are subtle divergences in momentum. Over the past 30 days, ETH has outperformed BTC, gaining 31.11% versus BTC's 22.61%. This suggests that during the recent rally, capital rotated into ETH more aggressively. In the last 24 hours, the dynamic has shifted slightly: BTC is down 1.03% while ETH is up 0.16%, showing relative strength for ETH in the short term. This could indicate that ETH is catching up to BTC's earlier move or that traders are rotating from BTC to ETH. The 7-day performance is nearly identical (BTC +1.39%, ETH -0.05%), suggesting the short-term trend is synchronized. The key takeaway is that while both assets are moving in tandem, ETH is showing slightly more resilience at current levels, and its 30-day momentum is stronger. This relative strength is worth monitoring, as a sustained divergence could signal a shift in market leadership.
Strategy Fit
Given the current market conditions—strong uptrend, overbought RSI, and significantly reduced volume—the most suitable strategies are those that account for potential consolidation and range-bound trading.
Grid Trading: With both BTC and ETH trading near recent highs but showing signs of exhaustion (overbought RSI, low volume), a range-bound scenario is plausible. A grid trading bot, such as those available on Pionex, can automatically place buy and sell orders within a defined price range. For BTC, a grid set between the support at $78,720 and resistance at $81,479 could capitalize on short-term fluctuations. For ETH, a grid between $2,478 and $2,567 would be appropriate. This strategy is low-risk in a sideways market and does not require directional calls.
DCA (Dollar-Cost Averaging): The low-volume environment presents uncertainty. A DCA strategy, which involves buying fixed amounts at regular intervals, can smooth out entry prices over time. This is particularly effective in volatile markets where timing is difficult. Pionex offers DCA bots that can be configured to accumulate BTC or ETH gradually, mitigating the risk of buying at a local top.
Trend Following: The medium-term trend is clearly up, as indicated by the price being well above the 30-day MA. However, the overbought RSI and low volume suggest that chasing the trend at current levels is risky. A trend-following strategy with a trailing stop could be used to capture further upside while protecting against a sharp reversal. Pionex's trailing take-profit bot is designed for this purpose.
Not Recommended: High-leverage directional trading is not advisable in a low-volume, overbought environment, as the risk of a sharp, unexpected move is elevated. The market is currently in a state of low participation, which can amplify volatility.
Given the data, a combination of grid trading (to profit from the expected range) and a conservative DCA (to accumulate on any dips) appears to be the most balanced approach for today's conditions.
Risk Disclaimer
This market recap is for informational and educational purposes only and does not constitute financial advice, investment advice, trading advice, or any other type of advice. You should not treat any of the material provided as a recommendation to buy, sell, or hold any digital asset or to execute any specific trading strategy. Cryptocurrency markets are highly volatile and involve substantial risk, including the risk of total loss. Past performance is not indicative of future results. The data and analysis presented here are based on information available at the time of writing and may change without notice. Always conduct your own research and consult with a qualified financial advisor before making any investment decisions. You are solely responsible for your own trading and investment choices.
FAQ
What does an overbought RSI mean for BTC and ETH?
An RSI above 70 is typically considered overbought, suggesting that the asset's price has risen too quickly and may be due for a pullback or consolidation. However, in a strong uptrend, the RSI can remain overbought for a prolonged period. It is a warning signal, not a definitive sell indicator.
Why is trading volume so low today?
The current volume for both BTC and ETH is a fraction of their 7-day averages (0.4x and 0.31x, respectively). This indicates low market participation, which can occur during periods of indecision, holidays, or when the market is waiting for a major catalyst. Low volume can lead to increased volatility and unreliable price movements.
What is the significance of the 7-day and 30-day moving averages?
The 7-day moving average (MA7) is a short-term trend indicator. If the price is above the MA7, the short-term trend is considered up. The 30-day moving average (MA30) is a medium-term indicator. The current distance between the price and the MA30 ($79,425 vs. $68,334 for BTC) shows the strength of the recent rally.
How can I use the support and resistance levels provided?
Support levels are price points where buying pressure is expected to emerge, potentially halting a decline. Resistance levels are price points where selling pressure is expected to emerge, potentially halting an advance. Traders often use these levels to set entry and exit points, or to configure grid trading bots.
Are BTC and ETH moving in tandem?
Yes, historically, BTC and ETH have a high positive correlation. Currently, both are in similar technical positions (above MAs, overbought RSI, low volume). However, ETH has shown stronger 30-day momentum (+31.11%) compared to BTC (+22.61%), and in the last 24 hours, ETH has been relatively stronger than BTC.


