BTC ETH Daily Recap — 2026-08-31

BTC ETH Daily Recap — 2026-08-31
Today at a Glance
Bitcoin (BTC) and Ethereum (ETH) both posted modest intraday gains on August 31, 2026, closing a quiet weekend session that saw reduced volatility and thinner trading volumes. BTC advanced 0.34% to $77,946, while ETH rose 1.13% to $2,444. Despite the positive daily close, both assets remain in a short-term corrective phase, with 7-day losses of 1.33% (BTC) and 1.54% (ETH) following a strong rally earlier in August. The 30-day picture remains strongly bullish: BTC is up 22.61% and ETH has gained 29.64% over the past month. However, both assets are trading near the upper end of their recent ranges, with RSI readings in overbought territory (BTC at 79.5, ETH at 76.1). Trading volumes are notably subdued — roughly half the 7-day average for both assets — suggesting that the market is consolidating after a sharp run-up, with participants waiting for fresh catalysts.
Bitcoin Analysis
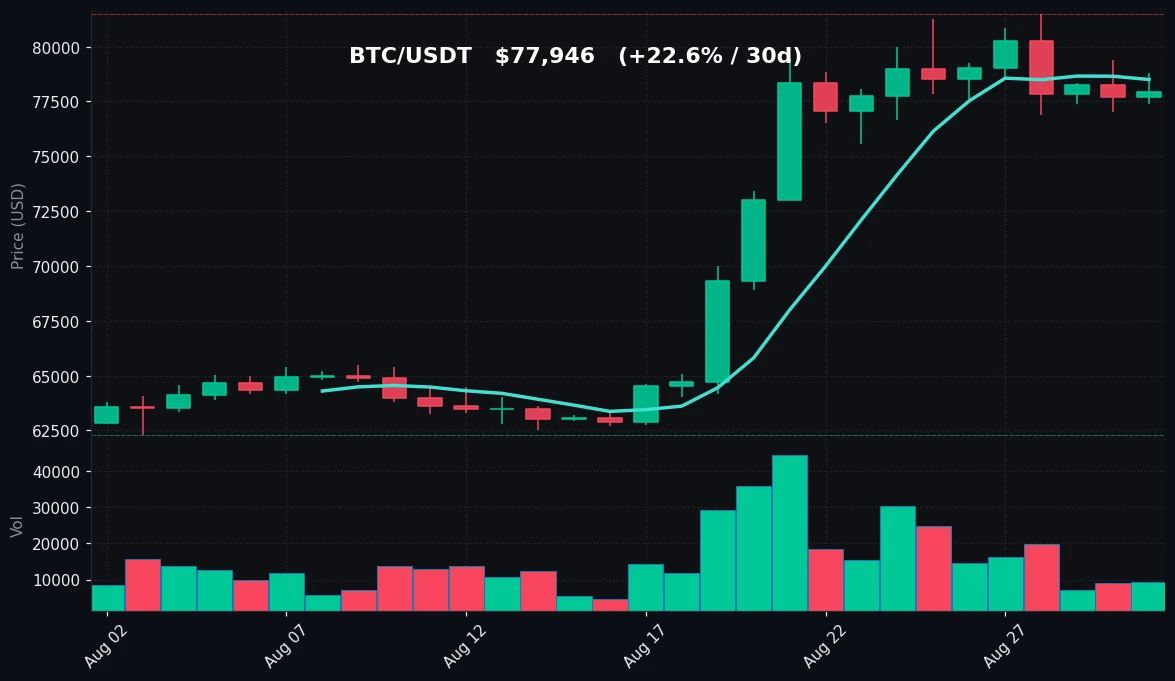
TradingView Live (4h)
Bitcoin is currently trading at $77,946, having printed a 24-hour range of $77,392–$78,802. The intraday move was contained, with the price oscillating in a relatively narrow band of roughly $1,400. Over the past seven days, BTC has ranged between $76,888 and $81,479, with the current price sitting in the lower-middle portion of that band. The 30-day range is significantly wider — from $62,300 to $81,479 — reflecting the powerful rally that took place earlier in August.
From a technical perspective, the short-term trend is showing signs of cooling. The 7-day moving average stands at $78,502, which is slightly above the current spot price, indicating that the immediate momentum has flattened. The 30-day moving average at $69,727 remains well below price, confirming the broader uptrend is still intact. The gap between the MA7 and MA30 is substantial (approximately $8,775), which is typical after a strong directional move but also highlights how stretched price is relative to the medium-term average.
The RSI(14) reading of 79.5 places Bitcoin firmly in overbought territory. This is the second consecutive week with RSI above 75, a condition that has historically preceded consolidation or pullbacks. However, in strong trending markets, RSI can remain elevated for extended periods before any meaningful correction occurs. The current reading does not suggest an imminent reversal but does indicate that upside momentum is becoming less sustainable at these levels.
Volume analysis reveals a notable slowdown. Current trading volume is running at 0.54x the 7-day average, indicating that participation has dropped significantly. This is a common pattern during weekend sessions, but the magnitude of the decline suggests that both retail and institutional players are waiting on the sidelines. Low volume in an overbought condition often leads to range-bound trading, as neither buyers nor sellers are willing to commit to a directional move.
Key levels to monitor include the recent 7-day high of $81,479, which serves as immediate resistance, and the 7-day low of $76,888 as nearby support. A break above the high would signal a continuation of the uptrend, while a loss of the low could open the door to a deeper retracement toward the $73,000–$74,000 zone, where the price found support during the early August consolidation.
Ethereum Analysis
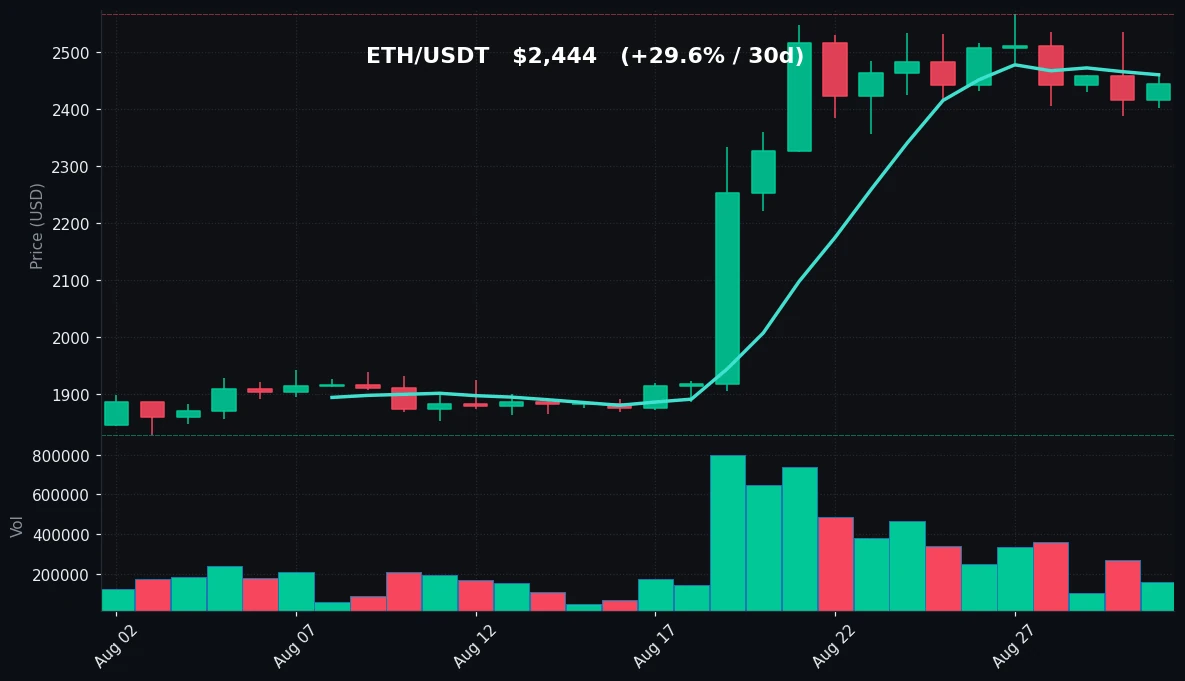
TradingView Live (4h)
Ethereum is trading at $2,444, up 1.13% on the day, with a 24-hour range of $2,401–$2,464. The intraday performance was slightly stronger than Bitcoin’s, though the overall pattern is similar: a modest bounce within a broader corrective phase. Over the past week, ETH has ranged between $2,387 and $2,567, with the current price positioned in the middle of that band.
The 30-day performance for ETH is notably stronger than BTC, with a gain of 29.64% compared to BTC’s 22.61%. This reflects ETH’s higher beta and its tendency to amplify Bitcoin’s moves in both directions. The 30-day range of $1,829–$2,567 shows that ETH has recovered substantially from its August lows, though it remains well below its historical highs.
Technical indicators for ETH mirror those of BTC but with slightly less extreme readings. The 7-day moving average is at $2,460, marginally above the current price, while the 30-day moving average sits at $2,128. The spread between these averages is approximately $332, which is significant but proportionally smaller than BTC’s gap. The RSI(14) at 76.1 is in overbought territory, though slightly less stretched than Bitcoin’s reading.
Volume for ETH is also subdued, running at 0.53x the 7-day average. This aligns with the broader market slowdown and suggests that ETH is likely to continue trading in a range until volume returns. The reduced participation makes it difficult for the asset to sustain a breakout attempt, but it also limits downside pressure.
From a structural perspective, ETH is trading above both its 7-day and 30-day moving averages, which is a bullish signal. The current consolidation appears to be a pause within a larger uptrend rather than a reversal. The key resistance level to watch is the 7-day high of $2,567; a decisive break above this level would likely attract fresh buying interest. On the downside, the 7-day low of $2,387 serves as immediate support, followed by the psychological $2,300 level and the 30-day moving average at $2,128.
The relative strength of ETH versus BTC in the daily session (1.13% vs 0.34%) is worth noting, as it may indicate that capital is beginning to rotate into ETH after a period of BTC dominance. However, a single day’s data is insufficient to confirm a trend shift, and the overall correlation between the two assets remains high.
Key Technical Levels
| Asset | Support | Resistance | RSI |
|---|---|---|---|
| BTC | $76,888 | $81,479 | overbought (79.5) |
| ETH | $2,387 | $2,567 | overbought (76.1) |
BTC vs ETH Dynamic
The correlation between Bitcoin and Ethereum remains strong, with both assets moving in tandem over the past 24 hours and the past week. BTC’s 7-day decline of 1.33% and ETH’s 1.54% decline show a similar magnitude of correction, while their 30-day gains (22.61% vs 29.64%) reflect ETH’s higher volatility profile. During the current consolidation phase, ETH has shown slightly more resilience, outperforming BTC by roughly 0.8% on the daily session. This is consistent with historical patterns where ETH tends to outperform during risk-on phases and underperform during risk-off periods. The ETH/BTC ratio has been trending upward over the past month, suggesting a gradual shift in investor preference toward ETH. However, the overall correlation remains close to 0.9, meaning that any significant move in BTC will likely be mirrored by ETH, albeit with amplified magnitude.
Strategy Fit
The current market conditions — characterized by overbought RSI readings, reduced volume, and a consolidation phase following a strong rally — call for a cautious approach. The low volatility environment (daily ranges of roughly 1.8% for BTC and 2.6% for ETH) is not ideal for trend-following strategies, as the lack of directional momentum increases the risk of whipsaw signals.
For traders looking to capitalize on the current range-bound conditions, a grid trading strategy may be appropriate. The established support and resistance levels (BTC: $76,888–$81,479; ETH: $2,387–$2,567) provide clear boundaries within which a grid bot can operate profitably. Pionex offers built-in grid trading bots that automatically place buy and sell orders within a defined price range, allowing users to profit from the oscillation without needing to constantly monitor the market.
For longer-term investors, a DCA (Dollar-Cost Averaging) approach remains viable, given that the broader 30-day trend is still bullish. However, entering at current levels carries elevated risk due to the overbought conditions, so a staggered entry or waiting for a pullback toward the 30-day moving average may be prudent.
Trend-following strategies are less suitable at this moment, as the momentum indicators are stretched and the volume contraction suggests that the current trend is losing steam. Traders employing such strategies may want to wait for a clearer signal — either a breakout above the recent highs on strong volume or a deeper correction that resets the RSI.
Pionex’s suite of automated trading bots includes options for grid trading, DCA, and trend-following strategies, allowing users to align their approach with prevailing market conditions. The platform’s built-in bots can execute these strategies automatically, removing the emotional component from trading decisions.
Risk Disclaimer
This market recap is provided for informational and educational purposes only and does not constitute financial advice, investment advice, trading advice, or any other form of professional advice. Cryptocurrency markets are highly volatile and involve substantial risk of loss. Past performance is not indicative of future results. The data presented herein is based on publicly available information and is believed to be accurate as of the date of publication, but no guarantee is made regarding its completeness or accuracy. You should conduct your own research and consult with a qualified financial advisor before making any investment decisions. Never invest more than you can afford to lose. The author and publisher of this document accept no liability for any losses incurred as a result of reliance on the information contained herein.
FAQ
Q1: Why is Bitcoin RSI overbought but the price is still below the 7-day moving average?
The RSI measures the magnitude of recent price changes and can remain in overbought territory even when the price pulls back slightly from a peak. In this case, BTC rallied sharply over the past 30 days, pushing RSI above 80. The recent pullback has been modest (less than 5% from the high), so RSI remains elevated despite the price dipping below the 7-day MA. This divergence often occurs during consolidation phases after strong trends.
Q2: What does the volume drop to 0.54x of the 7-day average indicate?
A volume reading of 0.54x means that current trading activity is roughly half of what it has been on average over the past week. This typically indicates reduced market participation, which can lead to lower volatility and range-bound trading. Low volume during a consolidation phase is generally considered neutral, but it can amplify price moves if a breakout occurs on thin liquidity.
Q3: How significant is the 30-day gain of 22.61% for BTC?
A 30-day gain of 22.61% is substantial for Bitcoin, representing a strong bullish phase. However, it’s important to note that such moves are often followed by consolidation or correction periods as traders take profits. The current overbought RSI reading suggests that the pace of gains may slow in the near term, but the move itself confirms that the broader trend is bullish.
Q4: Why is ETH outperforming BTC in the daily session?
ETH’s higher beta means it tends to move more than BTC in both directions. On days when the market is slightly positive, ETH often outperforms because of its higher volatility profile. Additionally, some traders may be rotating capital from BTC to ETH after BTC’s recent outperformance, seeking higher returns in the altcoin market.
Q5: Is it safe to enter a new position at current levels?
Given the overbought RSI readings and the proximity to recent resistance levels, entering a new position at current prices carries elevated risk of a short-term pullback. However, the medium-term trend remains bullish, and the current consolidation may provide a base for further upside. Traders should consider using limit orders, position sizing, and stop-losses to manage risk. A grid trading strategy or a staggered DCA approach may be more suitable than a lump-sum entry in these conditions.


