BTC ETH Daily Recap — 2026-09-04

BTC ETH Daily Recap — 2026-09-04
Today at a Glance
Both Bitcoin and Ethereum experienced a modest pullback on September 4, 2026, after a strong multi-week rally. Bitcoin slipped 2.20% over the past 24 hours to trade at $79,479, retracing from its 24-hour high of $81,428. Despite the daily decline, BTC remains up 2.10% over the past seven days and an impressive 23.56% over the last 30 days. Ethereum followed a similar trajectory, down 2.11% to $2,455, though its weekly performance is nearly flat at +0.48%. On the monthly horizon, ETH has outperformed BTC with a 28.91% gain. Notably, Bitcoin's RSI sits at 53.4, indicating neutral momentum, while Ethereum's RSI at 45.5 suggests slightly weaker short-term momentum. Volume for BTC is running at 0.92x its seven-day average, while ETH volume is elevated at 1.12x, suggesting increased activity around the altcoin leader.
Bitcoin Analysis
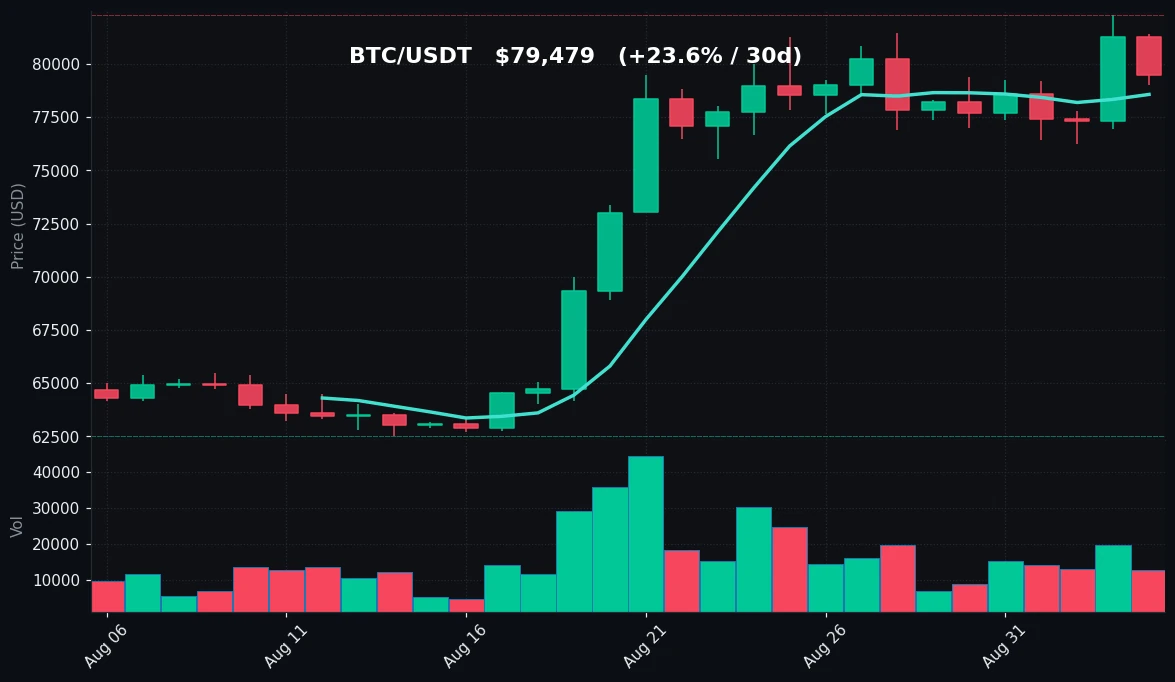
TradingView Live (4h)
Bitcoin is trading at $79,479, having established a 24-hour range between $79,000 and $81,428. The daily decline of 2.20% represents a pause after a rally that saw the asset climb from a 30-day low of $62,535 to a 30-day high of $82,300. The current price sits just above the seven-day moving average of $78,575, which has been providing dynamic support. The 30-day moving average stands at $71,737, a substantial distance below price, reflecting the strength of the recent uptrend.
From a technical standpoint, Bitcoin is in a consolidation phase within a broader bullish structure. The 30-day gain of 23.56% has carried the asset through multiple resistance levels, and the current pullback appears orderly rather than abrupt. The seven-day range spans from $76,264 to $82,300, with the midpoint near $79,282 — essentially where price is trading now. This suggests a balanced market in the short term, with neither buyers nor sellers holding a decisive edge.
Volume analysis shows that today's trading activity is at 0.92x the seven-day average, indicating slightly below-average participation. This is consistent with a consolidation day rather than a distribution event. The RSI(14) reading of 53.4 places Bitcoin in neutral territory, having cooled off from overbought conditions that likely accompanied the push toward $82,300. This reset in momentum indicators could provide a foundation for the next directional move.
Key levels to monitor include immediate support at the $79,000 psychological level and the MA7 at $78,575. Below that, the $76,264 seven-day low represents a more significant support zone. On the upside, $81,428 (24-hour high) and $82,300 (7d/30d high) form the immediate resistance cluster. The distance between price and the 30-day MA highlights the velocity of the recent advance, and any deeper correction could see the MA7 tested as the first line of defense.
Ethereum Analysis
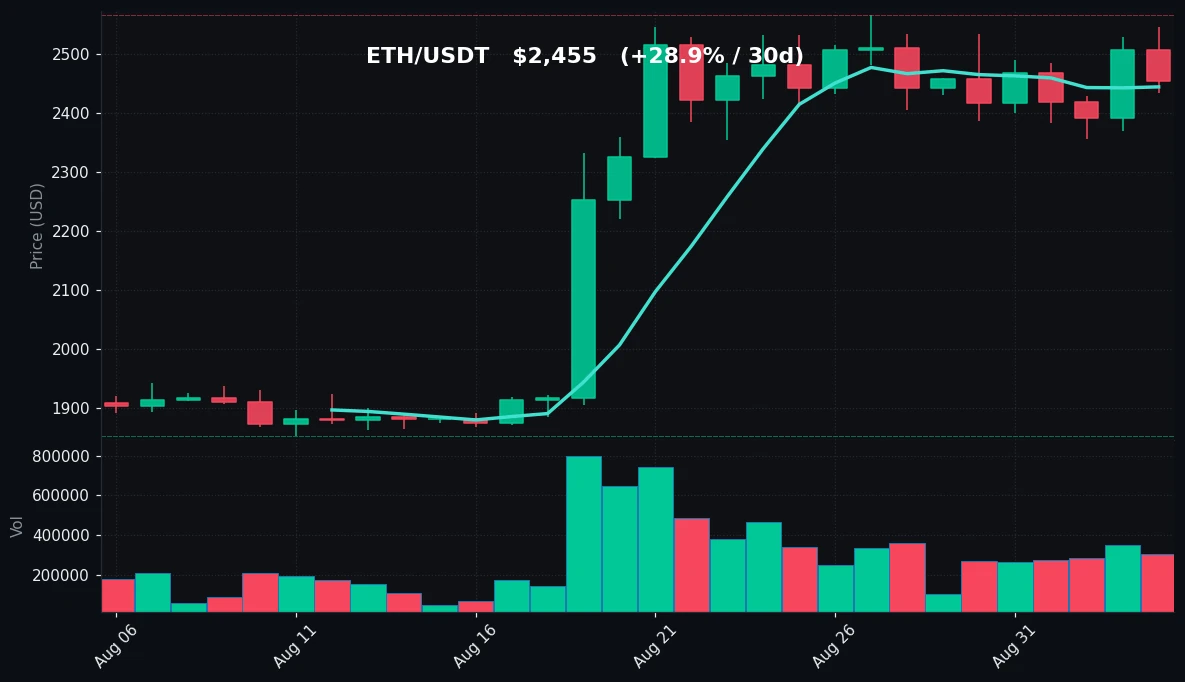
TradingView Live (4h)
Ethereum is trading at $2,455, down 2.11% over the past 24 hours. The intraday range spans from $2,435 to $2,547, with the asset closing near the lower end of that band. ETH's seven-day performance is nearly flat at +0.48%, suggesting the asset has been consolidating while BTC pushed slightly higher. However, the 30-day picture remains robust, with ETH up 28.91% from its 30-day low of $1,854.
The seven-day range for ETH runs from $2,356 to $2,547, and the current price sits near the upper-middle portion of that range. The MA7 at $2,445 is essentially where price is trading, indicating that short-term momentum has stalled. The MA30 at $2,204 remains well below price, confirming the broader uptrend is intact. Notably, ETH's 30-day high of $2,567 was set during this rally, and the asset has not yet broken above that level despite multiple attempts.
Ethereum's RSI(14) at 45.5 is more subdued than Bitcoin's, suggesting weaker relative momentum. This reading indicates that ETH has already undergone a more significant cooling-off phase compared to BTC. Volume data shows ETH trading at 1.12x its seven-day average, which is elevated relative to Bitcoin's 0.92x. This increased participation during a down day could signal either accumulation or distribution, depending on how the next sessions unfold.
From a structural perspective, Ethereum is testing the validity of its breakout above the $2,400–$2,450 zone. The recent rally from $1,854 to $2,567 represents a 38.5% advance, and the current consolidation appears healthy. The support cluster at $2,435–$2,445 (24-hour low and MA7) is the immediate level to watch. A break below this could open the path toward $2,356 (7-day low). Resistance sits at $2,547 (24-hour high) and the $2,567 30-day high. The flat weekly performance relative to BTC's +2.10% suggests ETH is lagging in the short term, though its superior 30-day performance indicates it led during the initial rally phase.
Key Technical Levels
| Asset | Support | Resistance | RSI |
|---|---|---|---|
| BTC | $78,575 (MA7) / $76,264 | $81,428 / $82,300 | Neutral (53.4) |
| ETH | $2,435 / $2,356 | $2,547 / $2,567 | Neutral-to-weak (45.5) |
BTC vs ETH Dynamic
The correlation between Bitcoin and Ethereum remains elevated, with both assets moving in tandem during the latest 24-hour session. BTC's 2.20% decline and ETH's 2.11% decline reflect a synchronized pullback, though the magnitudes differ slightly. Over the past week, a subtle divergence has emerged: BTC is up 2.10% while ETH is nearly flat at +0.48%. This suggests that during the recent consolidation phase, capital has favored Bitcoin over Ethereum. However, the 30-day picture flips this narrative — ETH's 28.91% gain outpaces BTC's 23.56%, indicating that Ethereum led the broader rally off the lows. RSI readings provide further context: BTC at 53.4 retains more short-term momentum, while ETH at 45.5 has cooled more significantly. This dynamic often precedes rotation — if BTC continues to consolidate, ETH may attract renewed buying interest given its relatively oversold short-term condition. The elevated ETH volume relative to its average also hints at position adjustments occurring beneath the surface.
Strategy Fit
The current market structure — Bitcoin consolidating above its MA7 with neutral RSI, and Ethereum cooling off with below-average momentum — presents distinct opportunities for systematic trading strategies.
For Bitcoin, the tight consolidation between $79,000 and $81,400 with an RSI near 53 suggests a range-bound environment in the short term. A grid trading strategy could capture value from the oscillation between these established support and resistance levels. Pionex's grid bots are well-suited to this scenario, automatically placing buy and sell orders within the defined range without requiring constant manual oversight. The below-average volume (0.92x) supports the notion that a breakout may not be imminent, favoring range-based approaches.
For Ethereum, the RSI at 45.5 and price sitting right at the MA7 suggest a potential reaccumulation phase. A DCA (dollar-cost averaging) strategy could be appropriate for ETH, particularly if the asset continues to test the $2,435 support level. Pionex's DCA bots allow for systematic accumulation during dips, which aligns with the current consolidation pattern. The elevated volume at 1.12x suggests institutional or large-scale participants are active, which could precede a directional move.
For traders with a longer horizon, the broader uptrend remains intact for both assets given their substantial 30-day gains and price well above the MA30. Trend-following strategies using trailing stops or Pionex's smart trade tools could help capture further upside while managing risk if the consolidation resolves downward. The key is to align strategy choice with the specific volatility profile of each asset — BTC appears range-bound, while ETH shows signs of building for the next leg.
Risk Disclaimer
This analysis is provided for informational and educational purposes only and does not constitute financial advice. Cryptocurrency markets are highly volatile and involve substantial risk of loss. Past performance, including the price movements and technical indicators discussed above, does not guarantee future results. You should conduct your own research and consult with a qualified financial advisor before making any investment decisions. Never invest more than you can afford to lose. The information presented here reflects market conditions as of 2026-09-04 and may become outdated quickly. Trading strategies mentioned, including grid trading and DCA, carry their own inherent risks and may not be suitable for all investors.
FAQ
Q: Why is Bitcoin down today despite strong weekly gains?
A: Bitcoin is down 2.20% in the last 24 hours after rallying from a 30-day low of $62,535 to a high of $82,300. This pullback appears to be a natural consolidation phase, with RSI cooling from overbought levels to a neutral 53.4. Volume at 0.92x the seven-day average suggests the decline lacks aggressive selling pressure.
Q: What does Ethereum's RSI of 45.5 indicate?
A: An RSI of 45.5 places Ethereum in neutral-to-weak territory, meaning short-term momentum has faded compared to its recent rally. This is a cooler reading than Bitcoin's 53.4, suggesting ETH may have undergone a more complete correction and could be positioned for renewed buying interest.
Q: How significant is the $82,300 level for Bitcoin?
A: The $82,300 level represents both the seven-day and 30-day high for Bitcoin, making it a critical resistance point. A sustained break above this level would confirm the continuation of the uptrend. Conversely, rejection at this level could lead to further consolidation within the current range.
Q: Why is Ethereum volume higher than Bitcoin's relative to their averages?
A: ETH is trading at 1.12x its seven-day average volume while BTC is at 0.92x. This elevated ETH activity during a down day suggests active position adjustments. It could indicate accumulation by buyers viewing the pullback as an opportunity, or distribution by sellers taking profits after the 28.91% monthly gain.
Q: What are the key support levels to watch if the decline continues?
A: For Bitcoin, the immediate support is the MA7 at $78,575, followed by the $76,264 seven-day low. For Ethereum, support sits at the $2,435 24-hour low, then $2,356 (seven-day low). A break below these levels would signal a deeper correction, while holding above them would suggest the consolidation is healthy.


