BTC ETH Daily Recap — 2026-09-05

BTC ETH Daily Recap — 2026-09-05
Today at a Glance
Bitcoin and Ethereum entered a pronounced consolidation phase on September 5, 2026, with both assets showing near-zero 24-hour movement. BTC/USDT traded at $79,673, essentially flat (+0.02%), oscillating within a tight $332 range between $79,442 and $79,774. Ethereum mirrored this stillness at $2,456, unchanged over 24 hours, with a similarly compressed intraday band of just $18. Despite the quiet session, the broader monthly picture remains strongly bullish: BTC is up +22.72% over 30 days, while ETH has gained +28.29% in the same period. The weekly perspective shows BTC retaining modest positive momentum (+1.85%), whereas ETH has stalled slightly (-0.08%). Notably, trading volumes have collapsed to 0.31x and 0.23x of their respective 7-day averages, indicating a significant drop in participation. This low-volatility, low-volume environment suggests the market is pausing to digest recent gains, with both assets holding comfortably above their 30-day moving averages.
Bitcoin Analysis
TradingView Live (4h)
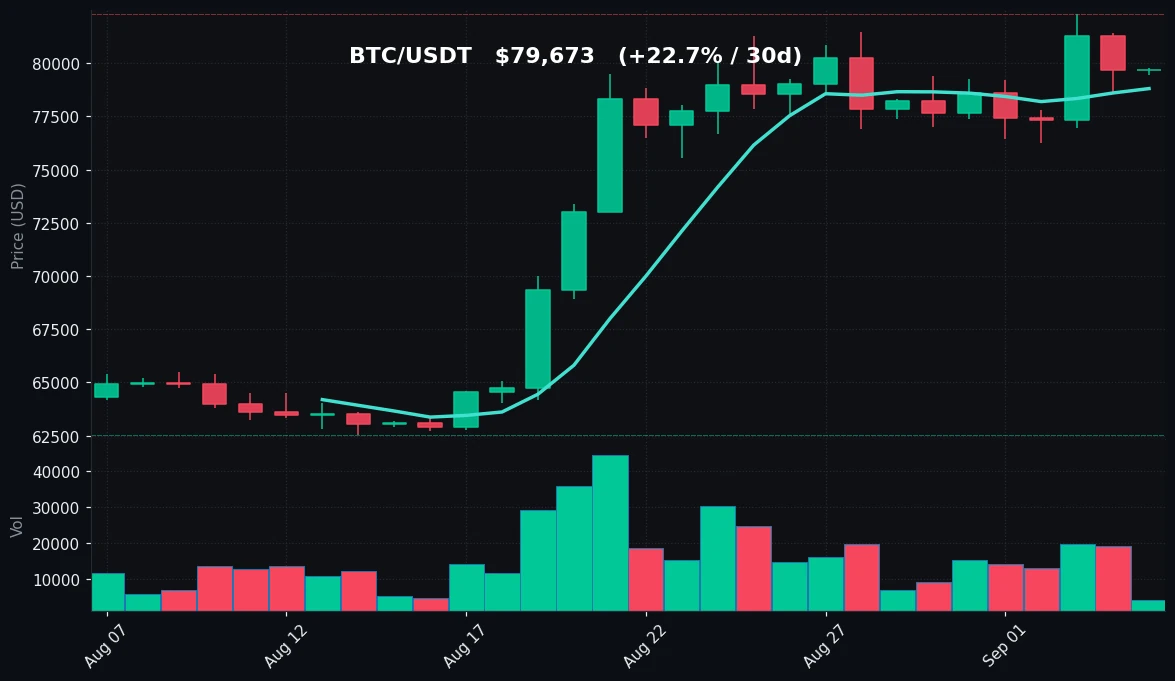
Bitcoin is exhibiting a clear post-rally consolidation pattern. The current price of $79,673 sits just 3.2% below the 7-day high of $82,300, which also marks the 30-day peak. This suggests the recent upward trajectory from the 30-day low of $62,535 has encountered a temporary ceiling near the $82,000–$82,300 zone. The pullback from that high has been orderly rather than aggressive, with BTC finding support above the $76,264 weekly low.
From a technical structure perspective, BTC remains firmly in a bullish configuration. The price is trading above both the 7-day moving average (MA7: $78,807) and the 30-day moving average (MA30: $72,255). The spread between these two averages — approximately $6,552 — indicates healthy short-term momentum without being overextended. The MA7 has acted as dynamic support during this consolidation, with the price bouncing off this level multiple times over the past several days.
The Relative Strength Index (RSI) at 58.6 provides a telling signal. This reading places BTC in neutral-to-bullish territory, well above the oversold threshold of 30 but below the overbought level of 70. Critically, the RSI has cooled from what would likely have been elevated readings during the sharp rally from $62,535 to $82,300. This reset suggests that the current consolidation is relieving overbought conditions rather than signaling trend exhaustion.
Volume analysis reveals the most notable characteristic of today's session: trading activity has contracted to just 0.31x the 7-day average. This represents a significant volume drought. Low-volume consolidation following a strong uptrend typically indicates that sellers are not aggressively distributing, but it also means the market lacks the conviction to push prices higher in the immediate term. The tight intraday range of $332 underscores this lack of directional commitment.
The daily chart shows a series of higher lows forming since the late-August low, a constructive pattern. However, the inability to reclaim the $82,300 level on multiple attempts suggests that overhead supply exists in that zone. Conversely, the resilience at the MA7 level indicates underlying demand. Bitcoin is effectively compressing between these two reference points, and the resolution of this range will likely depend on whether volume returns to the market.
Ethereum Analysis
TradingView Live (4h)
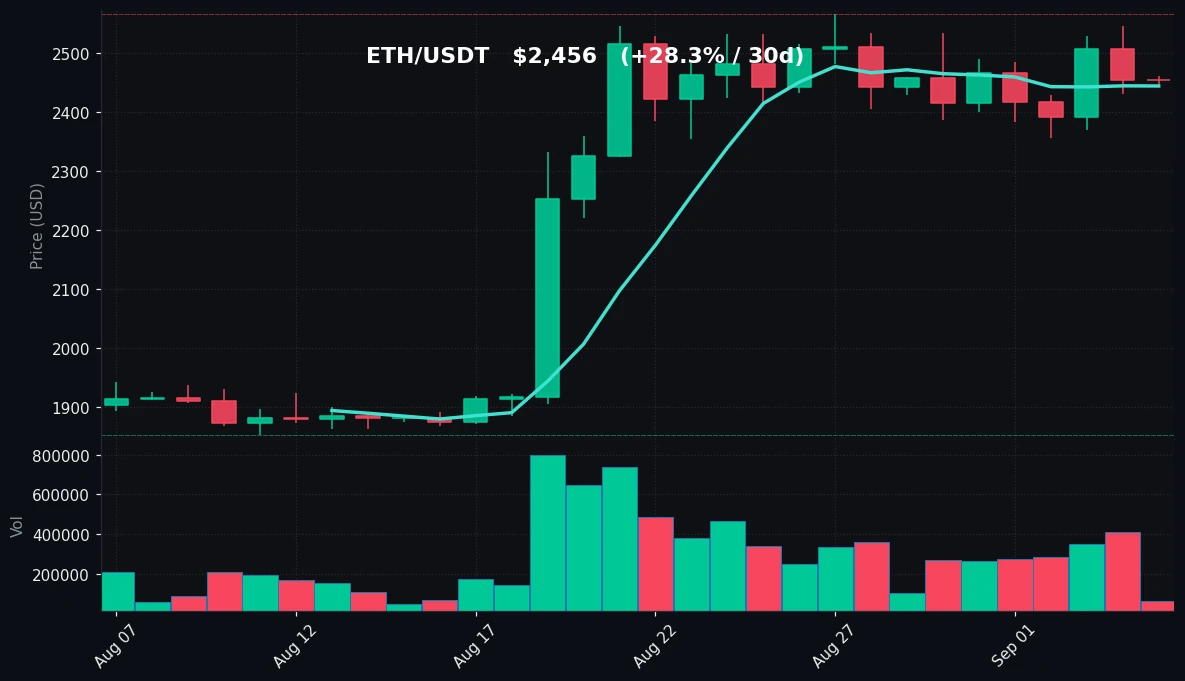
Ethereum is displaying a slightly different technical character than Bitcoin. At $2,456, ETH is essentially flat over both the 24-hour and 7-day timeframes (-0.08% weekly), yet it remains strongly positive over the monthly period with a +28.29% gain. The 30-day range tells a compelling story: ETH rallied from a low of $1,854 to a high of $2,567, representing a substantial 38.5% advance that has now settled into a narrow consolidation band.
The current price sits only 4.3% below the 30-day high of $2,567, and notably, the 7-day high of $2,547 is close to that level. This clustering of recent highs between $2,547 and $2,567 defines a clear resistance zone. The 7-day low of $2,356 provides a nearer support reference, with the price having held above this level during the week's pullback.
Ethereum's moving average structure remains bullish but shows a slightly different dynamic than Bitcoin's. The price trades above both the MA7 ($2,445) and MA30 ($2,222), confirming the overall uptrend. However, the proximity of the price to the MA7 — just $11 above it — indicates that ETH is testing its short-term trend support. This is a critical observation: a decisive break below the MA7 could expose the asset to a test of the 7-day low, whereas holding this level would maintain the constructive short-term structure.
The RSI for ETH stands at 52.8, notably lower than Bitcoin's 58.6. This reading suggests that Ethereum's momentum has cooled more substantially during the consolidation phase. The RSI has retreated from what would have been overbought levels during the rally toward $2,567, and the current neutral reading indicates that ETH has more room to move in either direction before reaching extreme conditions.
The volume profile for ETH is even more subdued than Bitcoin's, with trading activity at just 0.23x the 7-day average. This represents a severe liquidity contraction. Ethereum's intraday range of $18 — the tightest in recent memory — confirms that market participants are largely standing aside. This low-participation environment can sometimes precede sharp moves, as thin liquidity can amplify directional movement when participation returns.
The key technical distinction between ETH and BTC lies in their relative positions to their moving averages. While BTC enjoys a more comfortable cushion above its MA7 ($866 above), ETH is essentially sitting on this support level. This makes Ethereum marginally more vulnerable to short-term downside if the consolidation resolves bearishly, though the broader monthly trend remains firmly intact for both assets.
Key Technical Levels
| Asset | Support | Resistance | RSI |
|---|---|---|---|
| BTC | $78,807 (MA7) | $82,300 | Neutral (58.6) |
| ETH | $2,445 (MA7) | $2,567 | Neutral (52.8) |
BTC vs ETH Dynamic
The correlation between Bitcoin and Ethereum remains elevated, though today's session reveals subtle divergences in relative strength. Bitcoin has maintained a modest positive weekly performance (+1.85%) while Ethereum has slipped fractionally negative (-0.08%), suggesting that BTC is marginally outperforming during this consolidation. This dynamic is also reflected in their RSI readings (58.6 vs 52.8) and their positions relative to their 7-day moving averages. Bitcoin trades with a more comfortable buffer above its MA7, while Ethereum hovers just at this level. The 30-day performance gap has also narrowed, with ETH's +28.29% gain now only slightly exceeding BTC's +22.72%, a compression from earlier in the rally when ETH was more decisively outperforming. Historically, Ethereum tends to exhibit higher beta in both directions — amplifying BTC's moves during trend phases. The current environment, where both assets are rangebound with compressed volumes, suggests that the market is awaiting a directional catalyst. Should Bitcoin break above its $82,300 resistance, Ethereum would likely follow with amplified movement toward its $2,567 ceiling. Conversely, a breakdown in BTC could see ETH test its MA7 support more aggressively given its closer proximity to this level. The reduced volume across both assets indicates that the next directional move may be sharp when it arrives.
Strategy Fit
The current market microstructure — characterized by extreme low volatility, compressed intraday ranges, and significantly reduced trading volumes — presents a specific set of opportunities and challenges for trading strategies. For both BTC and ETH, the daily ranges have contracted to their narrowest levels in weeks, with BTC moving just $332 and ETH only $18 over the past 24 hours. This environment is largely unfavorable for trend-following strategies, as there is no directional momentum to capture.
Grid trading strategies are particularly well-suited to this consolidation phase. With BTC oscillating in a defined range between approximately $78,800 (MA7 support) and $82,300 (resistance), a grid bot can systematically capture profits from these oscillations. The key advantage of grid strategies in this environment is their ability to generate returns from rangebound price action without requiring directional prediction. The defined support and resistance levels identified in the technical analysis provide natural boundaries for grid parameter configuration. Pionex's grid trading bots are designed to operate effectively in such conditions, automatically buying low and selling high within the configured range.
For traders with longer time horizons, DCA (Dollar-Cost Averaging) strategies remain viable given that both assets continue to trade above their ascending 30-day moving averages. The monthly trend remains bullish, and systematic accumulation during this consolidation phase could prove advantageous if the uptrend resumes. Pionex offers DCA bots that automate this process, removing emotional decision-making from the equation.
Trend-following strategies, in contrast, are currently challenged. The absence of directional momentum, coupled with volume at 0.31x and 0.23x of average, means that breakout signals may lack conviction. Traders employing such strategies should exercise patience until volume returns to confirm any directional move. A confirmed break above $82,300 (BTC) or $2,567 (ETH) on above-average volume would provide a more reliable trend signal than the current low-participation environment.
The optimal approach in this market state may be a hybrid: maintaining a core position while deploying a grid bot to capitalize on the current range, with parameters set to respect the key technical levels identified above. This allows participation in any eventual breakout while generating yield from the ongoing consolidation.
Risk Disclaimer
This market recap is provided for informational and educational purposes only. It does not constitute financial advice, investment advice, trading advice, or any other form of professional advice. Cryptocurrency markets are highly volatile and involve substantial risk of loss. Past performance is not indicative of future results. The technical analysis, levels, and observations presented herein are based on historical data and current market conditions, which can change rapidly without notice. You should conduct your own research and consult with a qualified financial advisor before making any investment decisions. Never invest money that you cannot afford to lose. The author and publisher of this content accept no liability for any losses incurred as a result of reliance on the information provided.
FAQ
What is causing the extremely low trading volume today?
The current volume levels (0.31x for BTC and 0.23x for ETH relative to their 7-day averages) indicate a significant reduction in market participation. This typically occurs during consolidation phases when traders are awaiting a directional catalyst. The market has recently completed a substantial rally (BTC +22.72%, ETH +28.29% over 30 days), and the current low-volume environment suggests that both buyers and sellers are hesitating before committing to new positions. Such volume contractions often precede periods of increased volatility.
How significant is the RSI difference between BTC (58.6) and ETH (52.8)?
The 5.8-point RSI gap indicates that Bitcoin retains more short-term momentum than Ethereum, despite both being in neutral territory. BTC's higher RSI suggests it has held up better during the consolidation, while ETH's lower reading indicates a more significant cooling off after its stronger monthly rally. Neither asset is near overbought (70) or oversold (30) levels, meaning there is room for movement in either direction without immediate technical constraints.
What are the most important support and resistance levels to watch?
For Bitcoin, the immediate support is the 7-day moving average at $78,807, followed by the weekly low of $76,264. The critical resistance is at $82,300, which represents both the 7-day and 30-day high. For Ethereum, support sits at the MA7 of $2,445, with stronger support at the weekly low of $2,356. Resistance is clustered between $2,547 (7-day high) and $2,567 (30-day high). These levels define the current trading ranges and will likely determine the direction of the next significant move.
Does the low volatility mean a big price move is coming?
Historical patterns suggest that periods of extremely low volatility and volume often precede significant price movements, though the direction cannot be predicted from these conditions alone. The compression of daily ranges ($332 for BTC, $18 for ETH) combined with reduced participation creates conditions where a relatively small increase in trading activity can trigger amplified price movement. However, this does not guarantee an imminent breakout — consolidation phases can persist for extended periods.
How do the moving averages inform the current market structure?
Both assets are trading above their MA7 and MA30, confirming an overall bullish structure. The MA7 acts as short-term dynamic support, while the MA30 ($72,255 for BTC, $2,222 for ETH) represents the broader trend support. The significant distance between the 30-day low and current prices ($17,138 for BTC, $602 for ETH) illustrates the strength of the recent rally. The MA7- MA30 spread is positive for both assets, indicating that short-term momentum is still aligned with the longer-term uptrend, though the narrowing of this spread would signal weakening momentum.


