BTC ETH Daily Recap — 2026-09-07

BTC ETH Daily Recap — 2026-09-07
Today at a Glance
The crypto market opened the week on a subdued note, with both Bitcoin and Ethereum trading in narrow ranges amid thin weekend liquidity. Bitcoin slipped 1.23% over the past 24 hours to settle at $79,354, after briefly touching an intraday high of $80,444 and a low of $79,001. Ethereum fared slightly better, declining only 0.70% to $2,497, with its daily range contained between $2,537 and $2,475. Despite the short-term pullback, both assets remain in solid uptrends on the monthly timeframe — BTC is up 22.27% and ETH has gained 30.68% over the past 30 days. Volume has contracted significantly, with BTC trading at 0.47x its 7-day average and ETH at 0.57x, reflecting typical post-weekend consolidation. The RSI for both assets sits at 51.2, indicating balanced momentum without overbought or oversold conditions. Price action remains constructive above key moving averages, suggesting the market is digesting recent gains rather than reversing.
Bitcoin Analysis
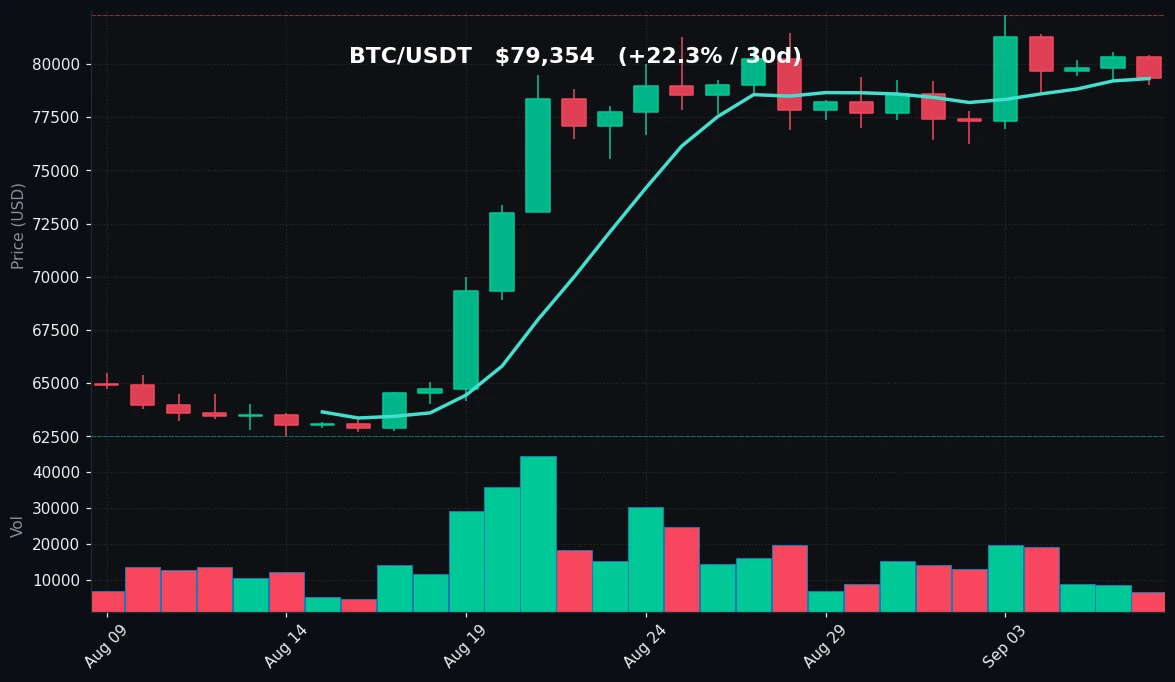
TradingView Live (4h)
Bitcoin is currently trading at $79,354, having pulled back 1.23% in the last 24 hours. The intraday range was relatively tight — high of $80,444 and low of $79,001 — indicating a market that is pausing after a strong monthly advance. Over the past week, BTC has shown resilience, gaining 0.98% despite a weekly range that stretched from $76,264 on the downside to $82,300 on the upside. The 30-day picture is more impressive: BTC has rallied 22.27% from a low of $62,535, demonstrating a sustained recovery from the sub-$63k levels seen in early August.
From a technical standpoint, BTC is trading just above its 7-day moving average of $79,320, which is acting as immediate support. The 30-day moving average sits at $73,254, well below the current price, confirming a bullish medium-term structure. The fact that price has held above the MA7 during this consolidation phase suggests buyers are defending recent gains. However, the inability to break above the $82,300 weekly high indicates that overhead supply exists at those levels.
Volume analysis reveals a significant drop in trading activity — current volume is only 0.47x the 7-day average. This is a classic weekend effect, but it also signals that the recent price action is occurring on thin participation. Low-volume pullbacks are generally viewed as less bearish than high-volume sell-offs, but they also mean that any sharp move could be amplified by a lack of liquidity.
The RSI(14) reading of 51.2 places Bitcoin in neutral territory, having cooled off from any overbought conditions that may have existed during the push toward $82,300. This gives room for upside without immediate technical resistance from momentum indicators. The 24-hour change of -1.23% is modest and does not alter the broader uptrend. Key observation: BTC is consolidating between the $79,000 support zone and the $82,300 resistance, with the MA7 acting as a pivot point. The market is in a state of equilibrium, awaiting a directional catalyst.
Ethereum Analysis
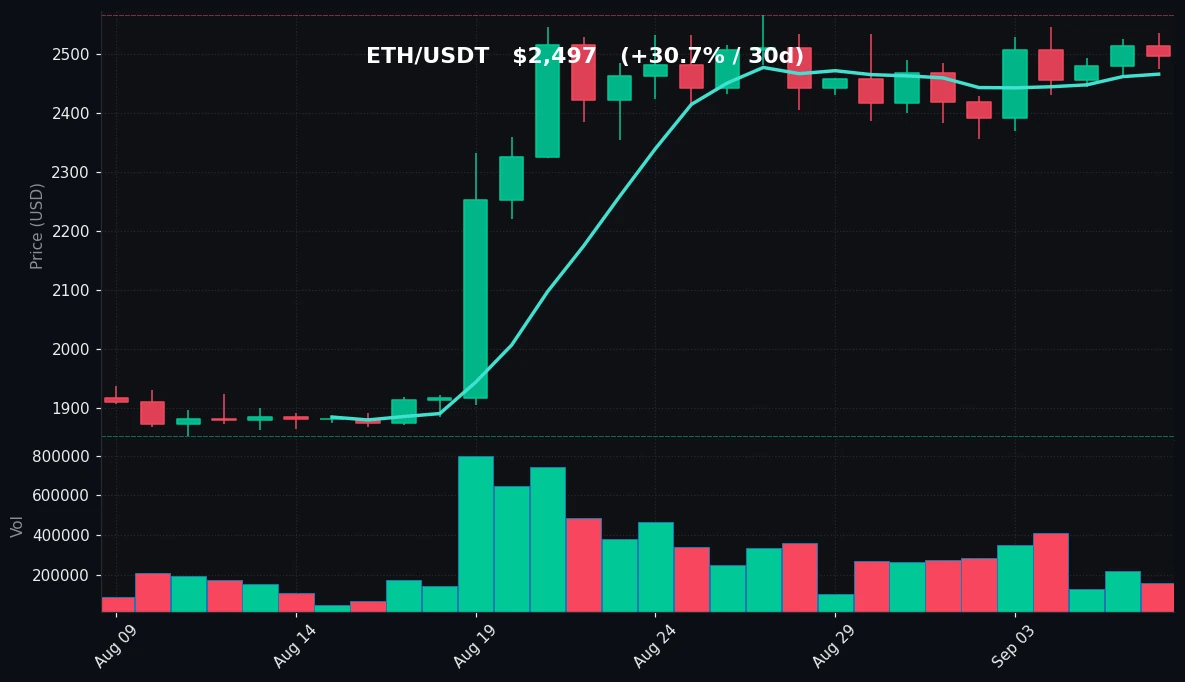
TradingView Live (4h)
Ethereum is trading at $2,497, down 0.70% over the last 24 hours. The daily range was $2,475 to $2,537, a narrow band that reflects the broader market's quiet demeanor. On the weekly timeframe, ETH has gained 1.18%, with a range spanning from $2,356 to $2,547. The 30-day performance is notably strong at +30.68%, with the asset recovering from a low of $1,854 to a high of $2,567. This represents a substantial rebound and places ETH in a firmly bullish medium-term trajectory.
Technically, ETH is trading above both its 7-day moving average ($2,466) and its 30-day moving average ($2,263). The distance between price and the MA30 is approximately 10.3%, indicating that the recent rally has been robust. The MA7 is providing near-term support, and the price action suggests that pullbacks are being bought. The weekly high of $2,547 is the immediate resistance to watch; a breakout above this level would open the path toward the psychological $2,600 mark.
Volume for ETH is currently at 0.57x its 7-day average, which, similar to BTC, points to reduced participation. This is not unusual for a Sunday session, but traders should note that low-volume conditions can lead to erratic price swings. The RSI(14) is at 51.2, identical to BTC's reading, reinforcing the notion that momentum is balanced — neither overbought nor oversold.
Ethereum's 24-hour decline of 0.70% is slightly less severe than Bitcoin's, which could indicate relative strength. However, ETH's beta to BTC remains a factor; if BTC faces selling pressure, ETH is likely to follow. The consolidation pattern between $2,475 and $2,547 suggests that ETH is building a base before its next move. Key support levels to monitor include the MA7 at $2,466 and the psychological $2,400 level. The market structure remains constructive, with higher lows on the daily chart since the August trough.
Key Technical Levels
| Asset | Support | Resistance | RSI |
|---|---|---|---|
| BTC | $79,000 / $76,264 | $80,444 / $82,300 | Neutral (51.2) |
| ETH | $2,466 / $2,356 | $2,537 / $2,567 | Neutral (51.2) |
BTC vs ETH Dynamic
Bitcoin and Ethereum continue to exhibit a high degree of correlation, with both assets showing identical RSI readings of 51.2 and similar percentage declines over the past 24 hours (-1.23% for BTC, -0.70% for ETH). This synchronized movement underscores the fact that macro factors, rather than asset-specific news, are currently driving the market. However, there are subtle divergences worth noting. Ethereum's 30-day gain of 30.68% outpaces Bitcoin's 22.27%, suggesting that ETH has a higher beta to the broader crypto market's upside. Conversely, during pullbacks, ETH tends to decline more sharply, although today's session showed ETH holding up slightly better than BTC. The correlation between the two remains a key risk factor — any significant move in Bitcoin will likely dictate Ethereum's direction in the short term. Traders should monitor the BTC/ETH ratio, which is currently around 31.8, to gauge relative strength shifts between the two assets.
Strategy Fit
Given the current market conditions — low volatility, reduced volume, and neutral RSI readings for both BTC and ETH — the environment is particularly well-suited for range-bound trading strategies rather than directional bets. With BTC consolidating between $79,000 and $82,300, and ETH between $2,475 and $2,547, a grid trading approach can capitalize on the oscillation within these defined ranges. Grid bots automatically place buy and sell orders at predetermined intervals, profiting from the natural price fluctuations without requiring the trader to predict a breakout direction.
For those using Pionex, the built-in Grid Trading Bot is a natural fit for this market structure. By setting a grid between the identified support and resistance levels, the bot can execute trades automatically as price moves up and down, generating consistent returns in a sideways market. The low volatility (relative to the past 30 days) means that price swings may be smaller, so a tighter grid spacing could be appropriate.
Alternatively, a DCA (Dollar-Cost Averaging) strategy remains viable for long-term accumulators. With both assets trading well above their 30-day lows but still below recent highs, adding to positions on any dips toward the MA7 support levels could be prudent. Pionex's DCA Bot allows for automated, periodic purchases that smooth out entry prices over time.
For more aggressive traders, a Trend Following strategy could be considered if BTC breaks above $82,300 or ETH above $2,567 on above-average volume. However, given the current volume contraction (0.47x and 0.57x of 7-day averages), waiting for confirmation is advisable. Pionex's Trailing Take Profit Bot or Smart Trade features can be used to capture a potential breakout while managing risk.
Risk Disclaimer
This market recap is for informational and educational purposes only and does not constitute financial advice, investment advice, trading advice, or any other sort of advice. Cryptocurrency markets are highly volatile and involve substantial risk of loss. Past performance is not indicative of future results. You should consult a qualified financial advisor before making any investment decisions. The data presented herein is based on historical price information and technical indicators, which are not reliable predictors of future market movements. Never invest money that you cannot afford to lose. Trading bots and automated strategies do not eliminate risk. Always conduct your own research and due diligence.
FAQ
Q1: Why are both BTC and ETH showing the same RSI of 51.2?
The RSI (Relative Strength Index) measures the magnitude of recent price changes to evaluate overbought or oversold conditions. When two highly correlated assets move in tandem — as BTC and ETH often do — their RSI values can converge to similar levels. In this case, both assets have experienced similar percentage gains and losses over the same 14-day lookback period, resulting in identical readings. This is a reflection of the strong correlation between the two largest cryptocurrencies.
Q2: What does low volume (0.47x and 0.57x of 7-day average) indicate?
Low volume indicates reduced market participation, which is common during weekends and holiday periods. In technical analysis, low-volume price movements are considered less reliable than high-volume moves. A price decline on low volume suggests that selling pressure is weak and may not signal a trend reversal. Conversely, any breakout on low volume should be treated with skepticism, as it may lack the conviction to sustain momentum.
Q3: Is the $82,300 level significant for Bitcoin?
Yes, $82,300 represents the 7-day and 30-day high for Bitcoin. This level has acted as resistance, with price being rejected twice in recent sessions. A decisive break above this level on above-average volume could signal a continuation of the uptrend. Until then, the market is likely to remain range-bound between the support at $79,000 and this resistance level.
Q4: How does Ethereum's 30-day performance compare to Bitcoin's?
Ethereum has outperformed Bitcoin over the past 30 days, with a gain of 30.68% compared to Bitcoin's 22.27%. This suggests that ETH has a higher beta — it amplifies the market's upward moves. However, this also means that in a downtrend, ETH could decline more sharply than BTC. The relative strength of ETH may be attributed to its different use cases, including DeFi and staking, as well as its lower price point attracting speculative interest.
Q5: What are the key levels to watch for Ethereum in the coming days?
For Ethereum, the immediate support level is the 7-day moving average at $2,466, followed by the weekly low of $2,356. On the upside, resistance is at the weekly high of $2,547, with a more significant barrier at the 30-day high of $2,567. A break above this range could target the psychological $2,600 level. Traders should also monitor Bitcoin's price action, as ETH often follows BTC's lead.


