BTC ETH Daily Recap — 2026-09-10

BTC ETH Daily Recap — 2026-09-10
Today at a Glance
Bitcoin is trading at $77,238, down 1.36% over the past 24 hours, with an intraday range between $76,676 and $78,564. On a weekly basis, BTC has shed 4.96%, though it remains up a substantial 21.67% over 30 days. Ethereum is at $2,437, off 1.25% in the last 24 hours, having traded between $2,406 and $2,485. ETH is down 2.81% on the week but up 29.65% over the month. Both assets are trading below their 7-day moving averages while holding well above their 30-day averages, a configuration that suggests a short-term pullback within a broader uptrend. Volume is notably light on both sides — BTC at 0.71x its 7-day average and ETH at 0.73x — indicating that today's move is more drift than conviction. RSI readings sit in neutral-to-soft territory: 39.8 for BTC and 43.3 for ETH.
Bitcoin Analysis
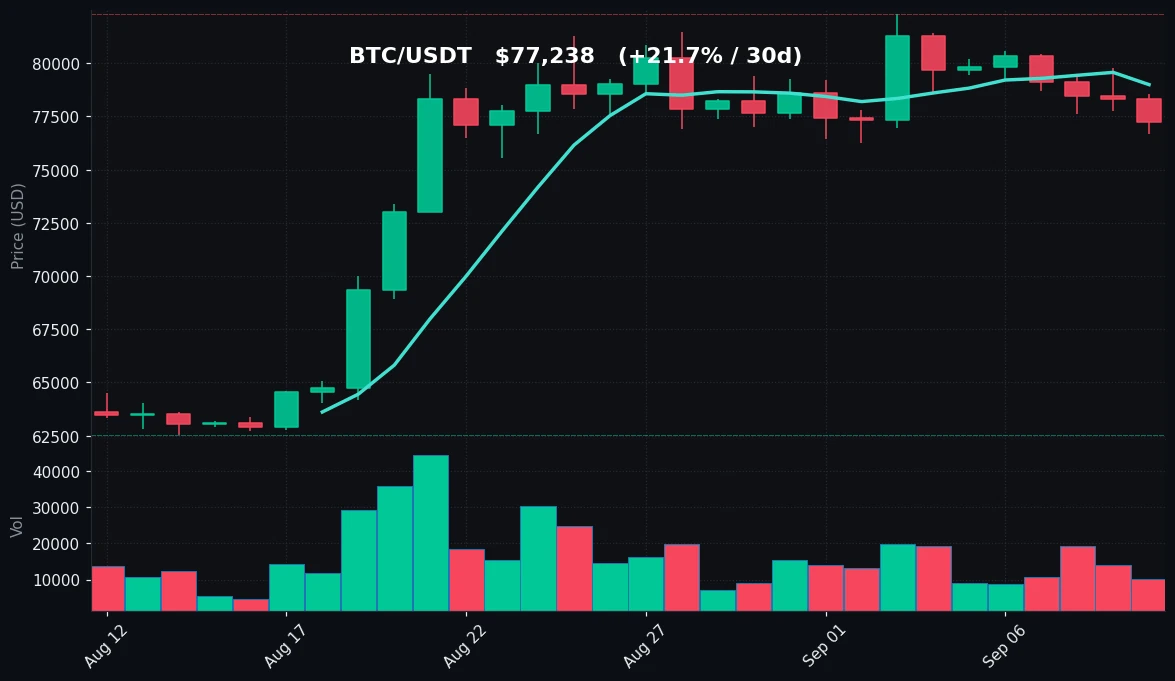
TradingView Live (4h)
Bitcoin's daily structure shows a market that has pulled back from recent highs but has not broken any major structural support. The 7-day high of $81,428 and 30-day high of $82,300 mark the ceiling of the recent advance, while the current price of $77,238 sits roughly 6% below the 30-day peak. The immediate technical reference is the 7-day moving average at $78,992, which BTC is trading beneath — a sign that short-term momentum has cooled. More important is the 30-day moving average at $74,630, which remains well below spot price and continues to slope upward, reflecting the strong 30-day gain of 21.67%.
The 24-hour range was relatively contained: a high of $78,564 and a low of $76,676, a spread of under $1,900. That low also coincides with the 7-day low, making $76,676 a level worth monitoring as near-term support. Above, the $78,564 intraday high and the $78,992 MA7 form a cluster of short-term resistance. A reclaim of that zone would put the $81,428–$82,300 region back in focus, but for now price is consolidating beneath it.
Volume is the notable feature of today's session. At 0.71x the 7-day average, participation is meaningfully below normal. Light volume on a modest down day is generally interpreted as a lack of aggressive selling rather than strong accumulation — neither side is pressing. This kind of low-conviction drift often precedes a volatility expansion, though direction is not implied.
RSI(14) at 39.8 places BTC in neutral territory with a slight tilt toward the lower half of the range. It is not oversold by the conventional 30 threshold, but it does show momentum has faded from the overbought conditions that likely accompanied the move toward $82,300. The combination of price below MA7, above MA30, soft RSI, and thin volume describes a cooling-off phase within a larger advance rather than a trend reversal.
On the downside, the sequence of support runs from the $76,676 7-day low, to the $74,630 MA30, and then toward the $62,535 30-day low — though that lower level is far from current action. On the upside, resistance is layered at $78,564, $78,992, then $81,428 and $82,300. The market is currently sandwiched between short-term resistance and medium-term support.
Ethereum Analysis
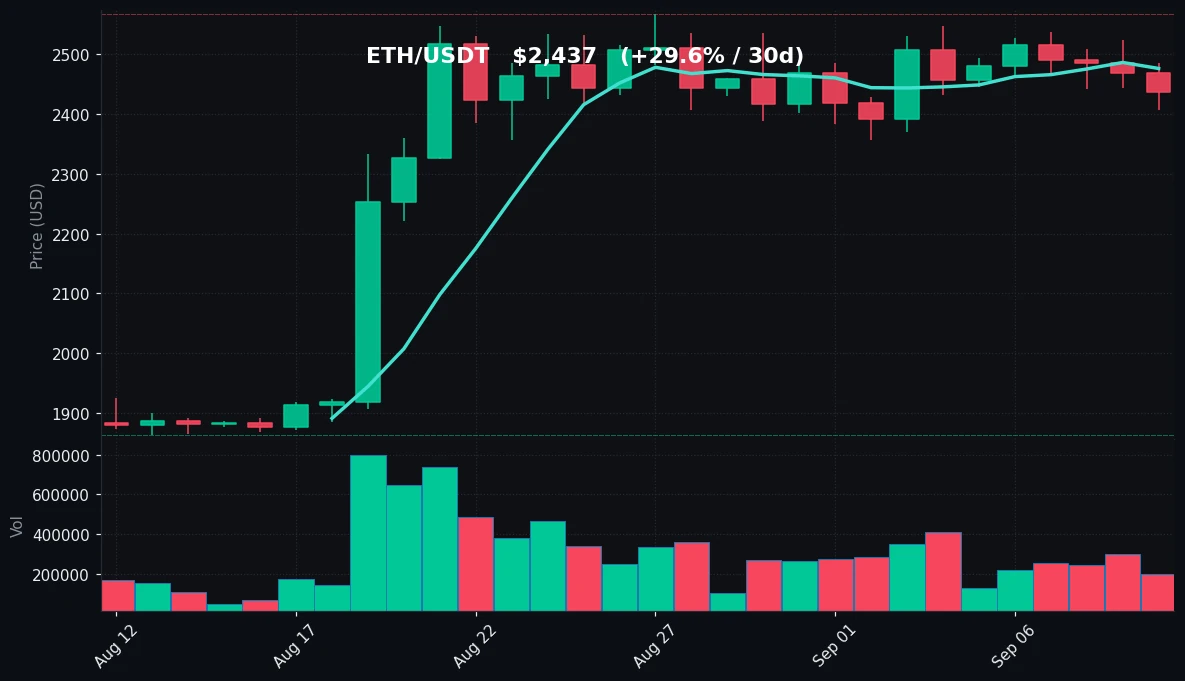
TradingView Live (4h)
Ethereum is trading at $2,437, down 1.25% on the day within a range of $2,406 to $2,485. The weekly change is -2.81%, but the 30-day change is a strong +29.65%, and the 30-day low of $1,864 underscores how far ETH has traveled over the past month. As with BTC, the current pullback is modest relative to the prior advance.
The moving average picture mirrors Bitcoin's: ETH is below its 7-day MA of $2,476 but comfortably above its 30-day MA of $2,320. The 7-day high of $2,547 and 30-day high of $2,567 sit just above current price, forming a tight resistance band. The 7-day low of $2,406 is essentially where today's low printed ($2,406), reinforcing that level as immediate support. Below that, the $2,320 MA30 is the next meaningful technical floor.
Volume tells a similar story to BTC: 0.73x the 7-day average, indicating subdued participation. Today's decline is happening on light turnover, which suggests the move is driven by a lack of bids rather than heavy distribution. ETH's 24-hour range of roughly $79 is narrow in percentage terms, consistent with a quiet consolidation session.
RSI(14) at 43.3 is neutral, marginally stronger than BTC's 39.8. ETH has not reached oversold conditions, and momentum has simply normalized after the strong 30-day run. The fact that ETH's 30-day gain (+29.65%) exceeds BTC's (+21.67%) indicates ETH has been the relative outperformer over the past month, and today's slightly smaller decline (-1.25% vs -1.36%) continues that mild relative strength.
Structurally, ETH's key levels are clear. Support: $2,406 (7-day low and today's low), then $2,320 (MA30). Resistance: $2,476 (MA7), then $2,547–$2,567 (7-day and 30-day highs). The price is compressed between near-term support and the MA7, a setup that reflects indecision. The 30-day low of $1,864 is a distant reference point that highlights the scale of the monthly recovery rather than an active level.
Key Technical Levels
| Asset | Support | Resistance | RSI |
|---|---|---|---|
| BTC | $76,676 / $74,630 | $78,564 / $78,992 / $81,428 | 39.8 (neutral) |
| ETH | $2,406 / $2,320 | $2,476 / $2,547 / $2,567 | 43.3 (neutral) |
BTC vs ETH Dynamic
BTC and ETH are moving in close lockstep today, with declines of 1.36% and 1.25% respectively — a spread of just 11 basis points. Both are trading below their 7-day moving averages and above their 30-day averages, both show RSI in the low-to-mid 40s or high 30s, and both are experiencing volume around 0.71–0.73x their 7-day averages. This high degree of correlation is typical during low-volume consolidation phases, when macro sentiment rather than asset-specific catalysts drives price. The one subtle divergence is on the monthly timeframe: ETH's +29.65% outpaces BTC's +21.67%, and ETH's intraday decline is slightly shallower. That suggests a modest relative-strength edge to ETH, though not enough to constitute a decoupling. For traders, the practical takeaway is that today's setup is a market-wide pause, not an asset-specific story.
Strategy Fit
Today's conditions — low volume (0.71–0.73x average), neutral RSI, and price compressed between short-term support and resistance — are characteristic of a range-bound, low-volatility session. In such environments, mean-reversion and range-capture strategies tend to fit better than aggressive trend-following, since there is no clear directional momentum and breakouts on thin volume are prone to failure.
Grid strategies, which profit from oscillation within a defined range, are a natural conceptual fit when price is bounded between identifiable support and resistance — for BTC that band is roughly $76,676 to $78,992, and for ETH roughly $2,406 to $2,476. DCA (dollar-cost averaging) approaches can also suit choppy, indecisive markets by smoothing entries over time rather than chasing a single price point. Trend-following strategies, by contrast, generally require sustained directional movement and expanding volume, neither of which is present today.
Pionex offers built-in bots designed for exactly these conditions — including Grid Trading bots, DCA bots, and rebalancing tools — allowing users to automate range-based or accumulation strategies without leaving the platform. That said, strategy selection should always match individual risk tolerance, capital, and time horizon, and no bot removes market risk.
Risk Disclaimer
This content is for informational purposes only and does not constitute financial, investment, or trading advice. Cryptocurrency markets are highly volatile and can result in the loss of your entire investment. The technical levels, indicators, and strategy references discussed above are observations based on historical price data and do not predict future outcomes. Always conduct your own research and consult a qualified financial professional before making any investment decisions. Past performance is not indicative of future results.
FAQ
What is Bitcoin's price on 2026-09-10?
BTC/USDT is trading at $77,238, down 1.36% over 24 hours, with a daily range of $76,676 to $78,564.
What is Ethereum's price on 2026-09-10?
ETH/USDT is trading at $2,437, down 1.25% over 24 hours, with a daily range of $2,406 to $2,485.
Are BTC and ETH overbought or oversold today?
Neither. BTC's RSI(14) is 39.8 and ETH's is 43.3 — both in neutral territory, though BTC leans toward the lower half of the range.
What are the key support and resistance levels right now?
For BTC, support sits at $76,676 and $74,630, with resistance at $78,564, $78,992, and $81,428. For ETH, support is at $2,406 and $2,320, with resistance at $2,476, $2,547, and $2,567.
Why is trading volume so low today?
BTC volume is 0.71x and ETH volume is 0.73x their respective 7-day averages, indicating subdued participation. Low-volume sessions often reflect indecision or a pause in activity rather than a strong directional signal from either buyers or sellers.


