BTC ETH Daily Recap – July 27, 2026

BTC ETH Daily Recap – July 27, 2026
Today at a Glance
Bitcoin and Ethereum showed contrasting intraday behavior on July 27, 2026, with BTC edging marginally lower while ETH posted a modest gain. Bitcoin traded in a $909 range, touching a daily high of $65,745 before settling at $65,340, down 0.09% over the past 24 hours. The asset remains in a consolidation phase near its 30-day high of $66,956, with volume slipping to 0.6x the 7-day average — indicating reduced participation. Ethereum, on the other hand, continued its relative outperformance, rising 0.49% to $1,964, with a tighter daily range of $44. The asset is now up 3.12% over the past week and nearly 25% over the past month, supported by stronger volume (0.85x the 7-day average). Both assets remain above their respective 7-day and 30-day moving averages, with RSI readings suggesting neutral-to-bullish momentum without entering overbought territory. The market appears to be in a wait-and-see mode, with BTC lacking directional conviction while ETH shows gradual accumulation.
Bitcoin Analysis
TradingView Live (4h)
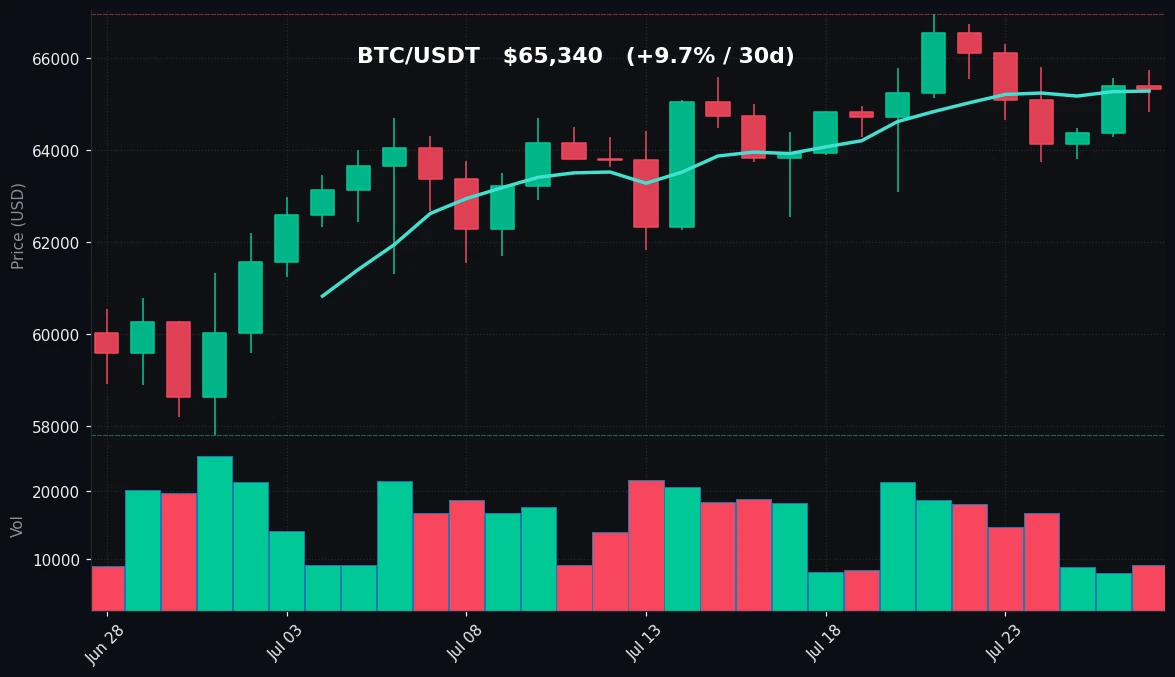
Bitcoin’s price action on July 27 reflects a market in pause. After reaching a 7-day high of $66,956 earlier in the week, BTC has since pulled back into a tight consolidation zone between $64,836 and $65,745. The current price of $65,340 sits just above the 7-day moving average of $65,289, a level that has provided intraday support. The 30-day moving average of $63,528 is well below current price, confirming a medium-term bullish structure — BTC has gained 9.67% over the past 30 days, recovering from a 30-day low of $57,800.
Key technical levels to watch include the $63,740 support (7-day low) and the $66,956 resistance (7-day and 30-day high). The RSI(14) at 64.2 indicates neutral-to-bullish momentum, still below the 70 overbought threshold. This suggests room for further upside, but the lack of volume is concerning. Volume is currently at 0.6x the 7-day average, the lowest relative reading in the past week. This decline in participation often precedes either a breakout or a breakdown, as thin liquidity can amplify price swings.
The daily chart shows a series of higher lows since the June lows near $57,800, with each successive low holding above the prior one. However, the inability to break decisively above $66,956 creates a potential double-top pattern if price fails to reclaim that level. The $65,000 round number has acted as both support and resistance intraday, with price oscillating around it. Without a volume catalyst — such as a macroeconomic event or ETF flow data — BTC may continue to drift sideways. The Bollinger Bands on the daily timeframe are narrowing, often a precursor to a volatility expansion. Traders should monitor whether BTC can hold above the MA7 ($65,289) and the psychological $65,000 level. A close below $64,836 (today’s low) could open a path to retest $63,740.
Ethereum Analysis
TradingView Live (4h)
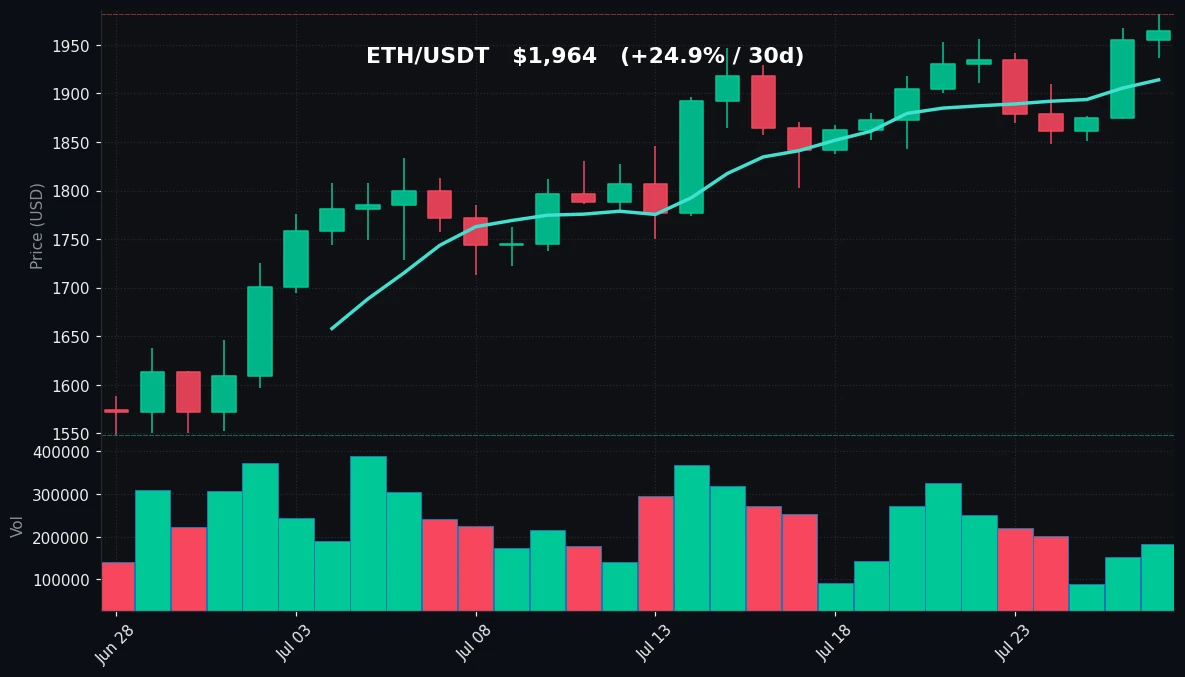
Ethereum continues to demonstrate relative strength against Bitcoin, posting a 0.49% gain on the day to reach $1,964. The asset traded between $1,937 and $1,981, with the latter representing both the daily and 7-day high. ETH has now gained 3.12% over the past week and an impressive 24.95% over the past 30 days, recovering from a 30-day low of $1,548. The current price sits comfortably above both the 7-day moving average ($1,914) and the 30-day moving average ($1,806), confirming a bullish trend.
The RSI(14) at 69.3 is approaching the overbought threshold of 70, but remains in neutral territory. This reading is higher than BTC’s 64.2, reflecting ETH’s stronger momentum. Volume is at 0.85x the 7-day average, a healthier level than BTC’s 0.6x, suggesting more active participation in ETH trading. The daily range of $44 is relatively tight, indicating that the market is absorbing supply at higher levels without a significant selloff.
Key support levels include $1,848 (7-day low) and $1,806 (MA30). Resistance is at $1,981 (current 7-day and 30-day high), with a breakout above this level potentially targeting the psychological $2,000 mark. The $1,548 low from 30 days ago now appears distant, and the recovery has been consistent with higher lows and higher highs. The weekly chart shows ETH breaking above the $1,900 resistance that had capped price in early July.
One notable observation is the declining volume on up days. While volume is still above BTC’s relative reading, it has been trending lower as price approaches resistance. This divergence could signal a need for a consolidation or minor pullback before the next leg higher. The MACD on the daily timeframe remains positive, with the histogram still above zero but flattening. If ETH can maintain above $1,914 (MA7), the path to $2,000 remains open. A break below $1,937 (today’s low) would be the first sign of weakness.
Key Technical Levels
| Asset | Support | Resistance | RSI |
|---|---|---|---|
| BTC | $64,836 (daily low) / $63,740 (7d low) | $65,745 (daily high) / $66,956 (7d/30d high) | 64.2 (neutral) |
| ETH | $1,937 (daily low) / $1,848 (7d low) | $1,981 (daily/7d high) / $2,000 (psychological) | 69.3 (neutral, approaching overbought) |
BTC vs ETH Dynamic
The correlation between Bitcoin and Ethereum remains positive but has weakened slightly over the past week. While BTC is essentially flat over 24 hours (-0.09%), ETH has gained 0.49%, continuing a trend of ETH outperformance that has been evident over the past 30 days. ETH’s 30-day return of +24.95% more than doubles BTC’s +9.67%, indicating a rotation of capital into Ethereum. The ETH/BTC ratio has risen from approximately 0.030 on June 27 to 0.0301 today, a modest but persistent gain. However, volume dynamics differ: BTC’s volume is significantly below its 7-day average (0.6x) while ETH’s is closer to normal (0.85x), suggesting that the current move in ETH is backed by more conviction. If BTC can reclaim the $66,000 level with increased volume, it may pull ETH higher. Conversely, if BTC breaks below $64,800, ETH could face selling pressure despite its relative strength. The divergence in RSI readings (BTC 64.2 vs ETH 69.3) reinforces that momentum favors Ethereum in the near term.
Strategy Fit
Given the current market conditions — low volume on BTC, moderate volume on ETH, and both assets trading above key moving averages — a multi-strategy approach is warranted. For Bitcoin, the low volume (0.6x average) and narrow range suggest a grid trading strategy is suitable. A grid bot can capture profits from the oscillations between $64,800 and $65,800, where price has been consolidating. On Pionex, the BTC/USDT grid bot with a range of $64,500 to $66,500 and 10-15 grids would align with current volatility. For Ethereum, the stronger trend and higher volume (0.85x) make a trend-following strategy more appropriate. A trailing stop or a DCA bot accumulating on dips near $1,900 (MA7) could capitalize on the uptrend. Pionex’s DCA bot can be set to buy ETH at intervals below $1,920 with a take-profit target near $2,000. For risk-averse traders, a dual-asset grid combining BTC and ETH could balance the low BTC volatility with ETH’s stronger momentum. Given the RSI readings (both neutral), neither asset is in overbought territory, so aggressive selling is not yet warranted. However, traders should set stop-losses below $63,700 (BTC) and $1,840 (ETH) to protect against a sudden volatility expansion.
Risk Disclaimer
This market recap is for informational and educational purposes only and does not constitute financial advice, investment recommendation, or solicitation to buy or sell any digital asset. Cryptocurrency markets are highly volatile and involve substantial risk of loss. Past performance is not indicative of future results. All trading decisions should be made based on your own research, risk tolerance, and financial situation. You should consult with a qualified financial advisor before engaging in any trading activity. The technical indicators and levels mentioned are based on historical data and may not predict future price movements. The author and platform assume no liability for any losses incurred from trading activities.
FAQ
Q1: Why is Bitcoin volume so low compared to its 7-day average?
Bitcoin volume at 0.6x the 7-day average indicates reduced market participation. This often happens during consolidation phases when traders are waiting for a catalyst, such as a macroeconomic event, ETF flow data, or a breakout above key resistance. Low volume can lead to sudden price swings if a large order hits the order book.
Q2: Is Ethereum approaching overbought territory?
Ethereum’s RSI(14) is 69.3, which is below the 70 overbought threshold but approaching it. This suggests strong upward momentum but not yet extreme. If the RSI crosses above 70, it could indicate a short-term pullback is likely. However, in strong trends, RSI can remain above 70 for extended periods.
Q3: What are the key levels to watch for a potential breakout?
For Bitcoin, a breakout above $66,956 (7-day and 30-day high) with volume above the 7-day average would signal bullish continuation. For Ethereum, a close above $1,981 (current high) and then $2,000 would be a strong bullish signal. On the downside, BTC breaking below $64,836 and ETH below $1,937 would indicate weakness.
Q4: How do I use grid trading on Pionex for current market conditions?
On Pionex, you can create a grid bot for BTC/USDT by setting a price range that captures the current consolidation zone, e.g., $64,500 to $66,500. Set 10-20 grids for a balance of frequency and profit per trade. The bot will automatically buy low and sell high within this range. For ETH, a tighter range of $1,900 to $2,000 with 10 grids could work given the stronger trend.
Q5: Should I be concerned about the ETH/BTC ratio rising?
A rising ETH/BTC ratio indicates that Ethereum is outperforming Bitcoin. This is not necessarily a concern but reflects capital rotation. Historically, when ETH outperforms BTC, it can signal a broader altcoin season. However, if BTC breaks down, ETH may follow despite its relative strength. Monitor the ratio for a reversal below 0.0295 as a warning sign.


