BTC ETH Daily Recap — 2026-09-11

BTC ETH Daily Recap — 2026-09-11
Today at a Glance
Bitcoin closed the session at $79,505, up 3.84% over 24 hours after trading between $76,047 and $79,890. The move pushed BTC back toward the upper bound of its recent range, though the 7-day change remains marginally negative at -0.19%, reflecting a week of consolidation following a strong 30-day advance of 25.22%. Volume came in at 0.87x the 7-day average, suggesting the rally was not accompanied by unusual participation.
Ethereum was the standout performer, gaining 8.23% to $2,639 and printing a fresh 30-day high of $2,666. ETH's 7-day gain of 7.46% and 30-day gain of 39.92% both outpace BTC, and volume at 1.32x the 7-day average confirms broader participation. ETH's RSI(14) at 64.3 sits closer to overbought territory than BTC's 55.2, though neither has reached an extreme reading.
Bitcoin Analysis
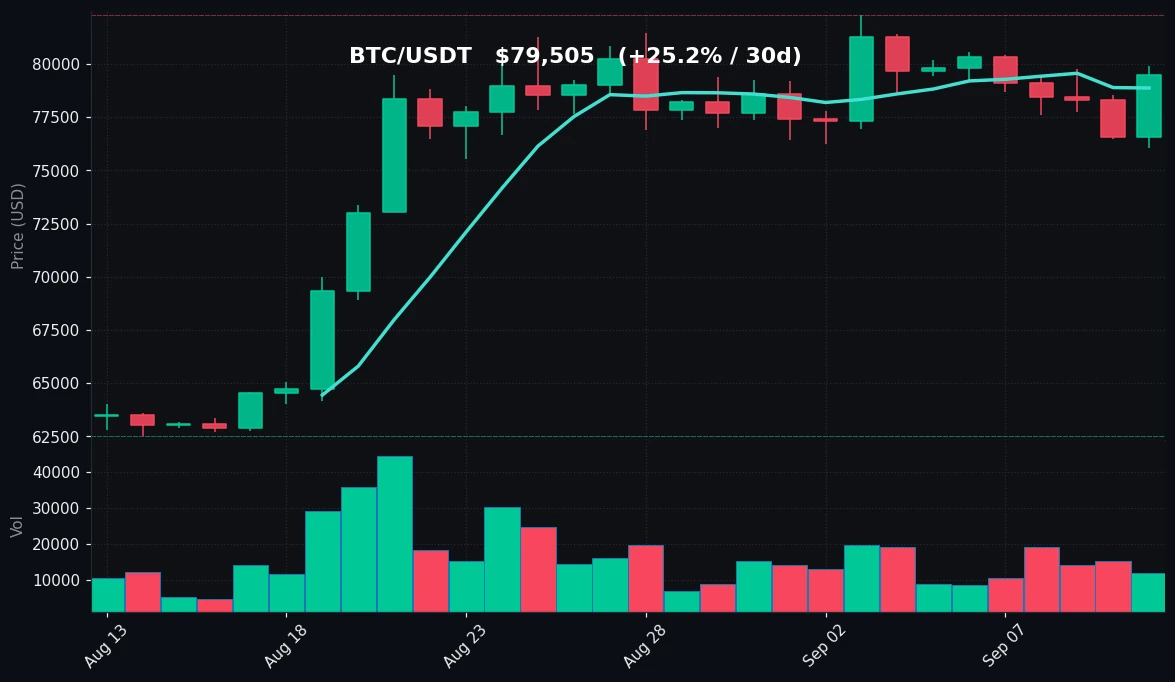
TradingView Live (4h)
Bitcoin's daily structure shows a market that has spent the past week digesting a substantial prior advance. The 30-day range runs from $62,535 to $82,300, a spread of roughly 31.6%, and the current price of $79,505 sits in the upper third of that band. The 7-day range is considerably tighter — $76,047 to $80,560 — indicating a compression phase after the larger move. Today's session resolved toward the top of that shorter range, with the intraday high of $79,890 falling just short of the 7-day high at $80,560.
On a moving-average basis, the picture remains constructive. The MA7 at $78,875 sits above the MA30 at $75,142, and price is trading above both. That configuration — price > MA7 > MA30 — is characteristic of a sustained uptrend on this timeframe, and the gap between the two averages (roughly $3,733, or about 4.9% of the MA30) indicates the trend has not yet flattened. The MA30 itself has likely been rising given the 30-day gain of 25.22%, which means the support reference is moving up beneath price.
Momentum reads as moderate. RSI(14) at 55.2 is in neutral territory — above the 50 midline but well below the 70 threshold commonly associated with overbought conditions. This is notable given that BTC is only about 3.4% below its 30-day high of $82,300. In other words, price is near range highs while momentum is not stretched, a combination that suggests the advance has not been driven by an unsustainable momentum spike.
Volume is the softer part of the picture. At 0.87x the 7-day average, today's 3.84% gain occurred on below-average turnover. That does not invalidate the move, but it does mean the breakout lacks volume confirmation. Traders watching for follow-through would typically want to see participation expand above 1.0x before treating a push through resistance as durable.
Key structural levels to monitor: on the downside, the MA7 at $78,875 is the first reference, followed by the 7-day low at $76,047 and the MA30 at $75,142. A sustained break below the MA30 would challenge the current uptrend structure. On the upside, the 7-day high at $80,560 is the immediate hurdle, with the 30-day high at $82,300 as the broader ceiling. The area between $80,560 and $82,300 represents the zone where prior sellers have stepped in.
Ethereum Analysis
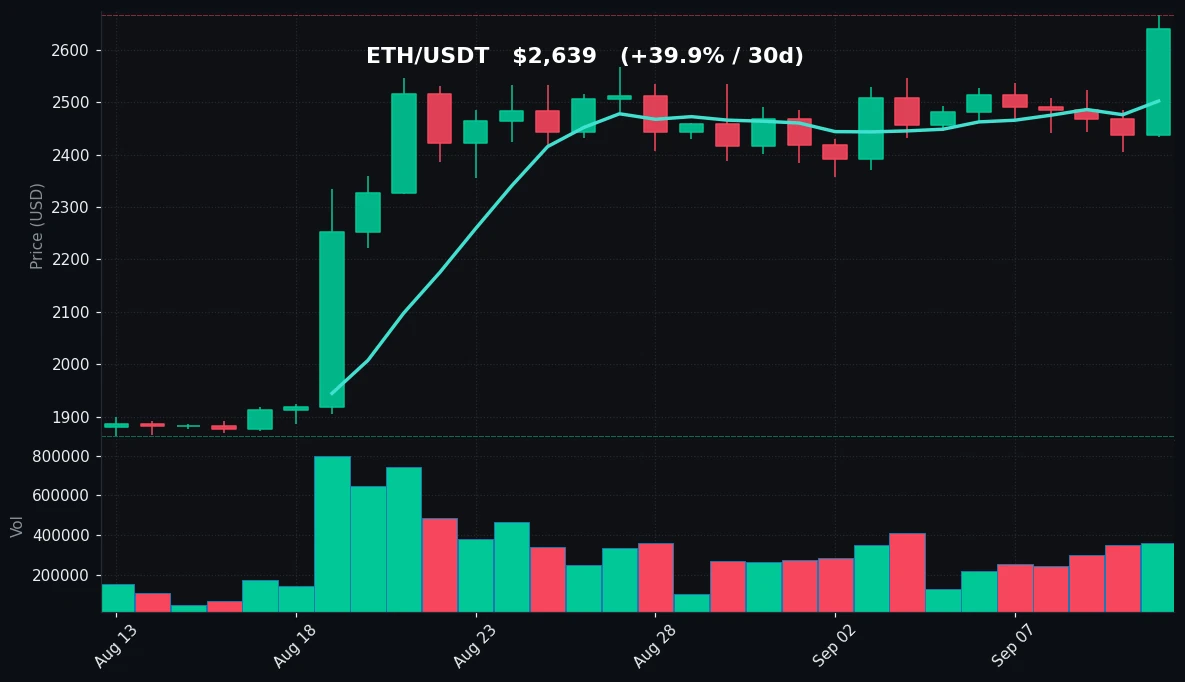
TradingView Live (4h)
Ethereum's session was decisively stronger than Bitcoin's. The 8.23% gain took ETH from a low of $2,434 to a high of $2,666 — and that high is also the 30-day high, meaning ETH closed the day at the top of its monthly range. The close of $2,639 is just 1.0% below that peak, a sign that buyers held control into the close rather than fading the move.
The trend structure is clearly bullish across both timeframes. Price at $2,639 is above the MA7 at $2,502, which is in turn above the MA30 at $2,345. The spread between the averages is approximately $157, or 6.7% of the MA30 — a wider separation than BTC's, indicating a steeper short-term trend. The 30-day range spans $1,864 to $2,666, a 43% spread, and ETH has now recovered essentially all of it, sitting at the very top.
Momentum is stronger here as well. RSI(14) at 64.3 is approaching but has not crossed the 70 overbought line. Given that ETH is at a 30-day high, an RSI in the mid-60s suggests the move has room before momentum becomes a contrarian concern — though it also means the easy part of the advance from the $1,864 low may be behind it.
Volume supports the move. At 1.32x the 7-day average, ETH saw meaningfully above-average turnover on its breakout day, a contrast with BTC's 0.87x. Rising price accompanied by expanding volume is generally a healthier signal than price gains on thinning participation, and it suggests the move reflects broader market engagement rather than a thin, easily reversed spike.
The 7-day change of 7.46% versus the 30-day change of 39.92% shows that a meaningful portion of ETH's monthly gain was captured in the last week — the trend has accelerated rather than decelerated. The 7-day low of $2,406 is now roughly 8.8% below the current price, and the MA7 at $2,502 sits about 5.2% below, making it the first meaningful support reference on a pullback.
Resistance is less defined given ETH is at a fresh 30-day high — there is no recent overhead supply from within the measured window. The $2,666 level itself is the immediate reference; a close above it would extend the range. Support tiers: $2,502 (MA7), then $2,406 (7-day low), then $2,345 (MA30).
Key Technical Levels
| Asset | Support | Resistance | RSI |
|---|---|---|---|
| BTC | $78,875 (MA7) / $76,047 (7d low) / $75,142 (MA30) | $80,560 (7d high) / $82,300 (30d high) | 55.2 — neutral |
| ETH | $2,502 (MA7) / $2,406 (7d low) / $2,345 (MA30) | $2,666 (7d & 30d high) | 64.3 — neutral, approaching overbought |
BTC vs ETH Dynamic
Today's session shows a clear divergence in relative strength. ETH's 8.23% gain more than doubled BTC's 3.84%, and ETH's volume expansion (1.32x) contrasted with BTC's contraction (0.87x). Both assets share the same directional bias — price above rising moving averages, RSI in neutral territory, and 30-day gains that are strongly positive — so the correlation on trend remains intact. What differs is intensity: ETH is at a 30-day high with volume confirmation, while BTC is still below its 7-day high with lighter participation. This kind of spread often reflects rotation within the crypto complex, where capital concentrates in the higher-beta asset during risk-on phases and rotates back to BTC during consolidation. The two are not moving independently, but ETH is currently expressing the same market view with greater amplitude.
Strategy Fit
The current environment presents two distinct profiles. BTC is range-bound within a compressed 7-day band ($76,047–$80,560) while holding a broader uptrend, with neutral RSI and below-average volume — conditions where range-trading approaches tend to see more activity than breakout approaches. ETH is trending at 30-day highs with above-average volume and rising momentum, a profile that historically suits trend-following more than mean-reversion.
Given that contrast, a reasonable framework is to match the tool to the regime rather than apply one approach across both. For BTC's compressed range, grid-style strategies — which place layered buy and sell orders around a defined band — are structurally aligned with sideways price action. For ETH's directional move, trend-oriented strategies that follow momentum rather than fade it may be more coherent, though trend entries at 30-day highs carry their own timing risk. For participants who prefer not to make an active regime call, DCA (dollar-cost averaging) remains a neutral way to build exposure without timing assumptions.
Pionex offers built-in bots that map directly onto these regimes — grid trading bots for range conditions, DCA bots for accumulation, and trend/momentum-style bots for directional markets. The relevant point is not that any strategy is "correct" today, but that the BTC/ETH divergence argues for differentiating approach by asset rather than applying a single template to both.
Risk Disclaimer
This recap is for informational purposes only and does not constitute financial, investment, or trading advice. It contains no price predictions. Cryptocurrency markets are highly volatile and can result in the total loss of capital. Technical indicators such as RSI, moving averages, and volume ratios are descriptive tools, not predictive guarantees. Past performance and current market structure do not indicate future results. Readers should conduct their own research and consult a qualified professional before making any trading or investment decision.
FAQ
What was Bitcoin's price on 2026-09-11?
BTC/USDT closed at $79,505, up 3.84% over 24 hours, with an intraday range of $76,047 to $79,890.
How did Ethereum perform compared to Bitcoin?
ETH gained 8.23% to $2,639 versus BTC's 3.84% gain, and ETH reached a 30-day high of $2,666 while BTC remained below its 7-day high of $80,560.
What do the RSI readings indicate?
BTC's RSI(14) is 55.2 and ETH's is 64.3. Both are in neutral territory — above the 50 midline but below the 70 level typically associated with overbought conditions.
Was today's move supported by volume?
ETH's move was, at 1.32x its 7-day average volume. BTC's was not, at 0.87x — below-average turnover alongside a 3.84% gain.
What are the key levels to watch?
For BTC: support at $78,875 (MA7) and resistance at $80,560. For ETH: support at $2,502 (MA7) and resistance at $2,666, its 30-day high.


