BTC ETH Daily Recap — 2026-09-14

BTC ETH Daily Recap — 2026-09-14
Today at a Glance
Bitcoin is trading at $78,314, up +1.92% over the past 24 hours, with an intraday range between $76,389 and $78,490. On a weekly basis, BTC remains modestly lower at -1.01%, though the 30-day picture is strongly positive at +24.51%. Ethereum is at $2,505, up +1.11% on the day, with a 24-hour range of $2,465 to $2,535. ETH is +0.58% over seven days and +33.51% over 30 days, making it the stronger medium-term performer of the two. Both assets are trading above their 7-day and 30-day moving averages, suggesting the short-term trend remains constructive even as momentum cools. Notably, volume is subdued: BTC volume is running at 0.63x its 7-day average and ETH at 0.52x, indicating participation is thin relative to recent activity. RSI readings sit in neutral territory — 49.0 for BTC and 53.4 for ETH — leaving room in either direction.
Bitcoin Analysis
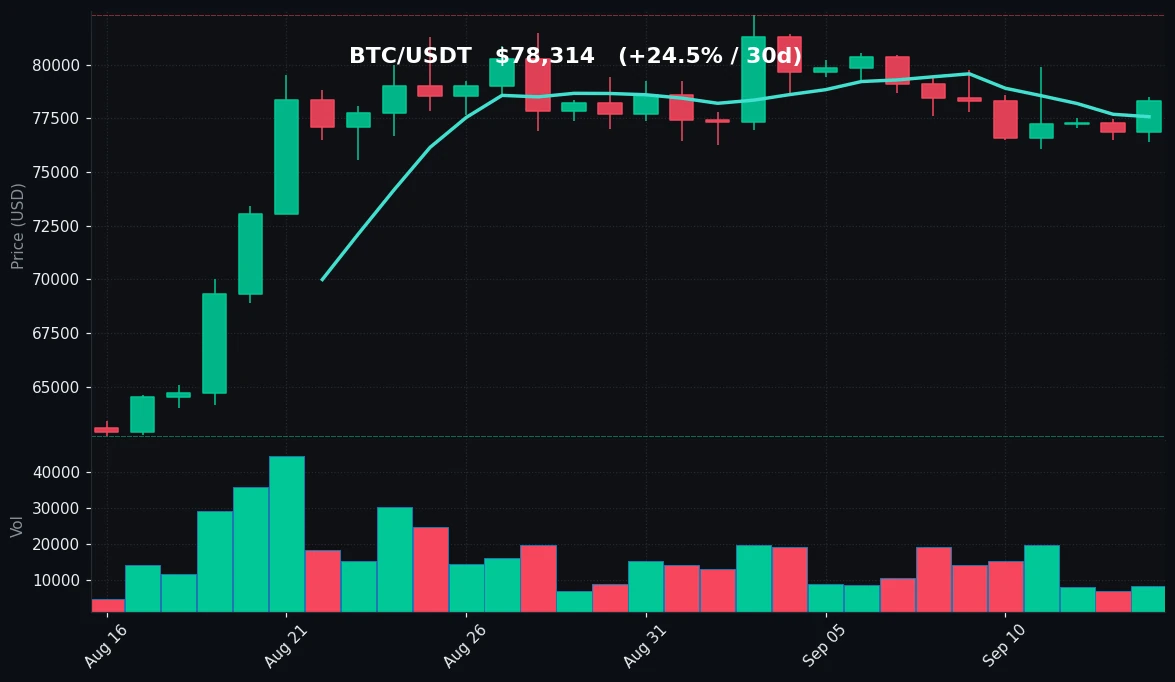
TradingView Live (4h)
Bitcoin's daily structure shows a market that has spent the past week consolidating after a strong 30-day advance of +24.51%. Price at $78,314 sits above both the MA7 ($77,570) and MA30 ($76,493), a configuration that keeps the short-term trend biased upward. The relationship between the two averages is also notable: the MA7 remains above the MA30, preserving a bullish crossover structure that has been in place during the recent rally. However, the gap between spot price and the moving averages is relatively modest, which suggests the market is digesting gains rather than extending them aggressively.
On the weekly timeframe, BTC is -1.01%, and the 7-day range of $76,047 to $79,890 shows a market that has oscillated within roughly a $3,800 band. The 30-day range is far wider, spanning from a low of $62,716 to a high of $82,300 — an approximately $19,600 spread that underscores how significant the past month's move has been. The current price of $78,314 sits in the upper portion of that 30-day range but below the peak of $82,300, placing BTC in a consolidation zone beneath recent highs.
Momentum is neutral. RSI(14) at 49.0 is essentially at the midpoint, a notable cooling from what would have been overbought conditions during the run to $82,300. This reset in momentum without a corresponding breakdown in price is often characteristic of consolidation rather than reversal, though it is not predictive on its own. Volume at 0.63x the 7-day average reinforces the picture of reduced participation — the market is not seeing aggressive buying or selling at current levels.
Key technical reference points: immediate support is visible around the MA7 at $77,570, with deeper support at the MA30 near $76,493 and the 7-day low at $76,047. To the upside, resistance is layered at the 7-day high of $79,890, followed by the 30-day high of $82,300. The 24-hour high of $78,490 marks the first near-term ceiling. As long as price holds above the moving average cluster, the structure remains constructive; a sustained break below $76,000 would weaken the short-term setup.
Ethereum Analysis
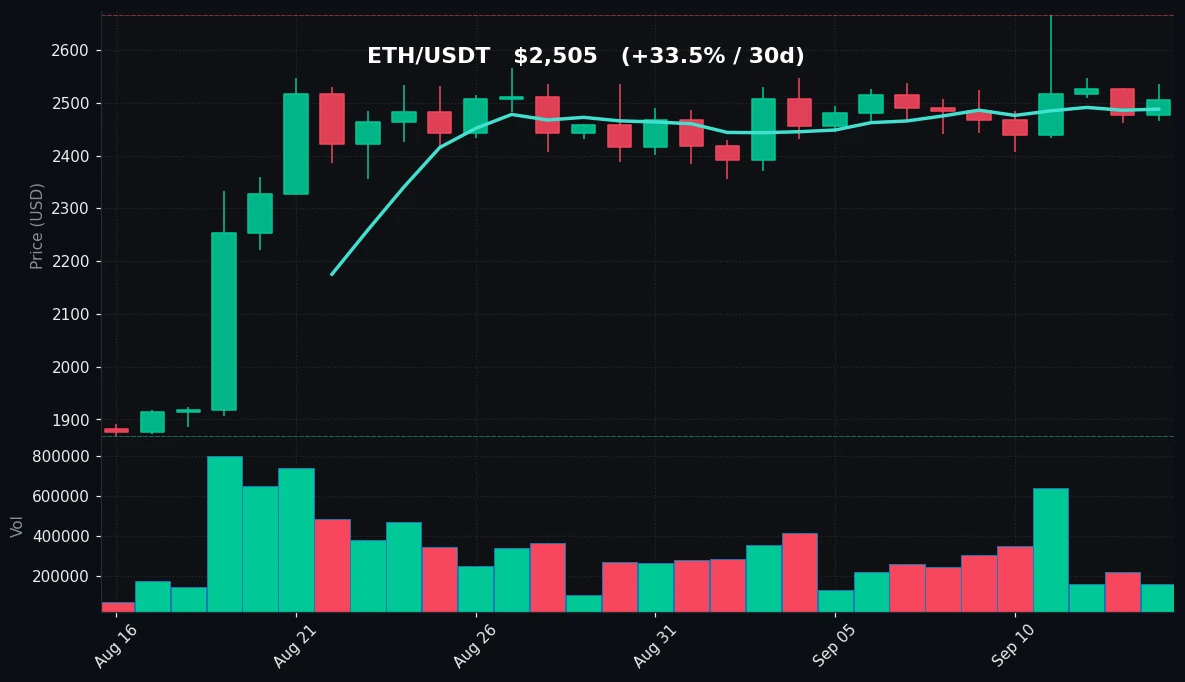
TradingView Live (4h)
Ethereum is trading at $2,505, up +1.11% on the day, and its medium-term performance outpaces Bitcoin with a +33.51% gain over 30 days versus BTC's +24.51%. The weekly change is a modest +0.58%, indicating ETH has also been consolidating after a substantial rally. Price sits above both the MA7 ($2,488) and MA30 ($2,403), maintaining a bullish moving-average alignment similar to Bitcoin's.
The most striking feature of ETH's recent data is the 30-day range: a low of $1,869 to a high of $2,666 — a spread of roughly $797, or approximately 43% from trough to peak. The current price of $2,505 is in the upper half of that range but below the 30-day high of $2,666, which also coincides with the 7-day high. This means ETH is consolidating just beneath a clearly defined resistance level. The 7-day low of $2,406 provides a reference for recent support, and notably, that level is close to the MA30 at $2,403, creating a confluence zone.
Momentum for ETH is slightly firmer than BTC's. RSI(14) at 53.4 is just above neutral, suggesting a mild positive bias without approaching overbought conditions. This is consistent with ETH's relative outperformance over the 30-day window. However, volume tells a more cautious story: ETH volume is at 0.52x its 7-day average, the lowest relative reading between the two major assets. Thin volume during consolidation can mean the market is simply waiting, but it also means moves can be exaggerated when participation returns.
Key technical reference points for ETH: support is clustered around the MA7 at $2,488, the 7-day low at $2,406, and the MA30 at $2,403. Resistance is defined by the 7-day and 30-day high at $2,666, with the 24-hour high of $2,535 acting as an immediate near-term cap. The 24-hour low of $2,465 marks the first line of intraday support. ETH's setup is one of a market holding gains above its moving averages while pausing beneath a well-established ceiling.
Key Technical Levels
| Asset | Support | Resistance | RSI |
|---|---|---|---|
| BTC | $76,047–$76,493 | $79,890–$82,300 | neutral (49.0) |
| ETH | $2,403–$2,406 | $2,535–$2,666 | neutral (53.4) |
BTC vs ETH Dynamic
BTC and ETH are moving in the same direction today, with both posting modest gains (+1.92% and +1.11% respectively), and both are consolidating above their short- and medium-term moving averages. The correlation remains evident in the shared pattern: a strong 30-day rally, a cooling of RSI into neutral territory, and volume running well below the 7-day average. Where they diverge is in magnitude and momentum. ETH has outperformed over 30 days (+33.51% vs +24.51%) and carries a slightly higher RSI (53.4 vs 49.0), suggesting marginally stronger relative momentum. BTC, meanwhile, has a wider 30-day range in absolute dollar terms and is further below its 30-day high on a percentage basis. The shared low-volume environment means neither asset is currently demonstrating decisive directional conviction, and the two remain broadly tethered in their consolidation phase.
Strategy Fit
Today's conditions — neutral RSI readings, price consolidating above moving averages, and volume at roughly half of recent averages — describe a range-bound, low-conviction environment rather than a strong trending one. In such conditions, range-trading and accumulation approaches tend to be more naturally suited than momentum-chasing strategies.
- Grid trading can be a reasonable structural fit when price is oscillating within defined boundaries. BTC's recent $76,047–$79,890 weekly range and ETH's $2,406–$2,666 range provide observable boundaries that grid strategies are designed to operate within. Pionex offers built-in grid trading bots that automate buy-low/sell-high execution inside a chosen range.
- DCA (dollar-cost averaging) may appeal to participants focused on the medium-term trend, given both assets remain above their 30-day moving averages and have posted strong 30-day gains. Pionex's built-in DCA bot allows scheduled, fixed-interval purchases, which can smooth entry during consolidation.
- Trend-following strategies are less naturally aligned today, since momentum has cooled and volume is thin; trend systems typically seek confirmation from expanding participation.
The choice depends on individual objectives and risk tolerance. Pionex's built-in bots — including grid and DCA — are tools that automate these approaches, but no strategy guarantees outcomes, and all carry risk.
Risk Disclaimer
This article is for informational purposes only and does not constitute financial, investment, or trading advice. Cryptocurrency markets are highly volatile and can result in the loss of all invested capital. The data and technical levels discussed reflect a single point in time (2026-09-14) and can change rapidly. No price predictions are made or implied. Readers should conduct their own research and consult a qualified financial professional before making any investment decisions. Past performance is not indicative of future results.
FAQ
Is Bitcoin up or down today?
BTC is up +1.92% over the past 24 hours, trading at $78,314, though it is -1.01% over the past seven days.
What are the key support and resistance levels for Bitcoin?
Near-term support sits around $76,047–$76,493 (7-day low and MA30), with resistance at $79,890 (7-day high) and $82,300 (30-day high).
What is Ethereum's RSI telling us?
ETH's RSI(14) is 53.4, which is neutral but slightly above the midpoint, indicating mild positive momentum without overbought conditions.
Why is trading volume so low?
BTC volume is 0.63x and ETH volume is 0.52x their respective 7-day averages, suggesting reduced market participation during the current consolidation phase.
Which strategy fits today's market?
With neutral RSI and range-bound consolidation, grid and DCA strategies are commonly discussed as fitting such conditions; Pionex offers built-in bots for both, though all strategies carry risk and none guarantee results.


