BTC ETH Daily Recap — 2026-09-12

BTC ETH Daily Recap — 2026-09-12
Today at a Glance
Bitcoin is trading at $77,366, eking out a marginal +0.18% over the past 24 hours while sitting on a 7-day decline of -3.09%. The session range was unusually tight — a high of $77,401 against a low of $77,164 — a spread of roughly $237, or about 0.3% of spot. That compression stands out against the 7-day high of $80,560, which means BTC is currently positioned about 4% below its weekly peak. Volume tells the more important story: turnover ran at just 0.38x the 7-day average, confirming that this is a low-conviction consolidation rather than an active directional move.
Ethereum, by contrast, is showing relative strength. ETH changed hands at $2,543, up +1.04% on the day and +2.51% on the week, with a 30-day gain of +35.08%. Its 7-day range of $2,406–$2,666 places spot near the upper end of that band. ETH volume was even thinner at 0.3x the 7-day average — a notable divergence given the stronger price performance.
The headline for today: BTC is drifting sideways below its short-term moving average on fading volume, while ETH holds near weekly highs on equally thin participation. Both assets are consolidating after a strong 30-day expansion phase.
Bitcoin Analysis
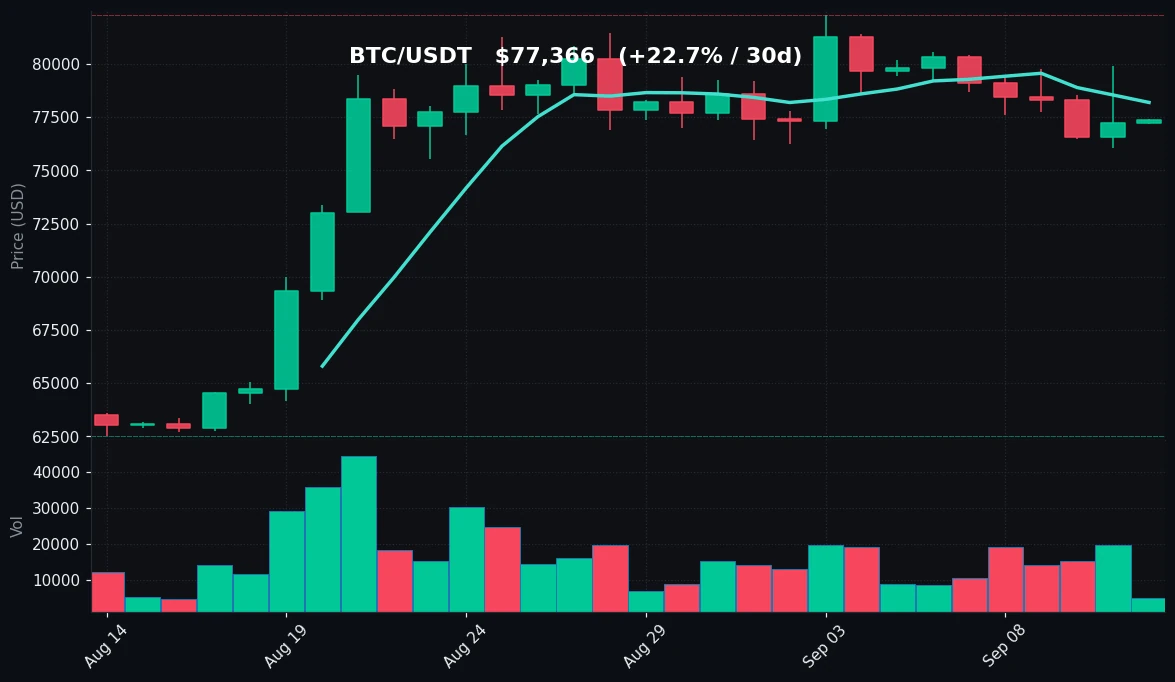
TradingView Live (4h)
Bitcoin's structure on the daily timeframe is best described as a controlled pullback within a larger uptrend. The 30-day performance of +22.72% is the dominant context: BTC rallied from a 30-day low of $62,535 to a 30-day high of $82,300, a move of roughly 31.6% peak-to-trough. Since tagging that $82,300 high, price has retraced to the current $77,366 area — approximately 6% off the monthly peak. That is a shallow retracement relative to the size of the advance, which typically indicates profit-taking rather than a trend reversal.
The moving average configuration is the key technical detail. The MA7 sits at $78,197, meaning spot at $77,366 is trading about $831 — roughly 1.1% — below the 7-day average. This tells us short-term momentum has cooled and the immediate trend bias is neutral-to-soft. However, the MA30 at $75,529 remains well below spot, with price holding about $1,837 (approximately 2.4%) above the 30-day average. The relationship is therefore constructive: the faster average has rolled over while the slower average continues to underpin. This is the classic signature of a consolidation phase inside a broader uptrend, not a breakdown.
Support and resistance levels are clearly defined by recent price action. Immediate support clusters around the 7-day low of $76,047, which also sits just above the MA30 at $75,529 — a confluence zone that gives the $75,500–$76,050 band added technical significance. Below that, the 30-day low at $62,535 marks the floor of the prior accumulation range. To the upside, initial resistance is the MA7 at $78,197, followed by the 7-day high at $80,560, and then the 30-day high at $82,300.
Momentum reads neutral. RSI(14) at 46.8 is below the 50 midline but nowhere near oversold territory. This is consistent with a market that has worked off an overbought condition — likely reached during the run to $82,300 — and is now resetting. An RSI in the mid-40s during a shallow pullback in an uptrend is generally a sign of healthy digestion rather than distribution.
The volume picture is the caveat. At 0.38x the 7-day average, participation is materially below normal. Low-volume pullbacks are ambiguous: they can indicate that sellers are exhausted and supply is drying up, or simply that there is no urgency from either side. What low volume does reliably signal is a lack of conviction behind the move. Given the tight $237 daily range, the market is effectively in a wait-and-see posture. The absence of volume means the current price level is not being aggressively defended or rejected — it is simply where the marginal trade is clearing.
In summary, BTC's technical posture is neutral within a broader uptrend: below the MA7, above the MA30, RSI mid-range, volume depressed, and price coiling in a narrow band. The $76,000 support and $78,200 resistance levels frame the immediate decision zone.
Ethereum Analysis
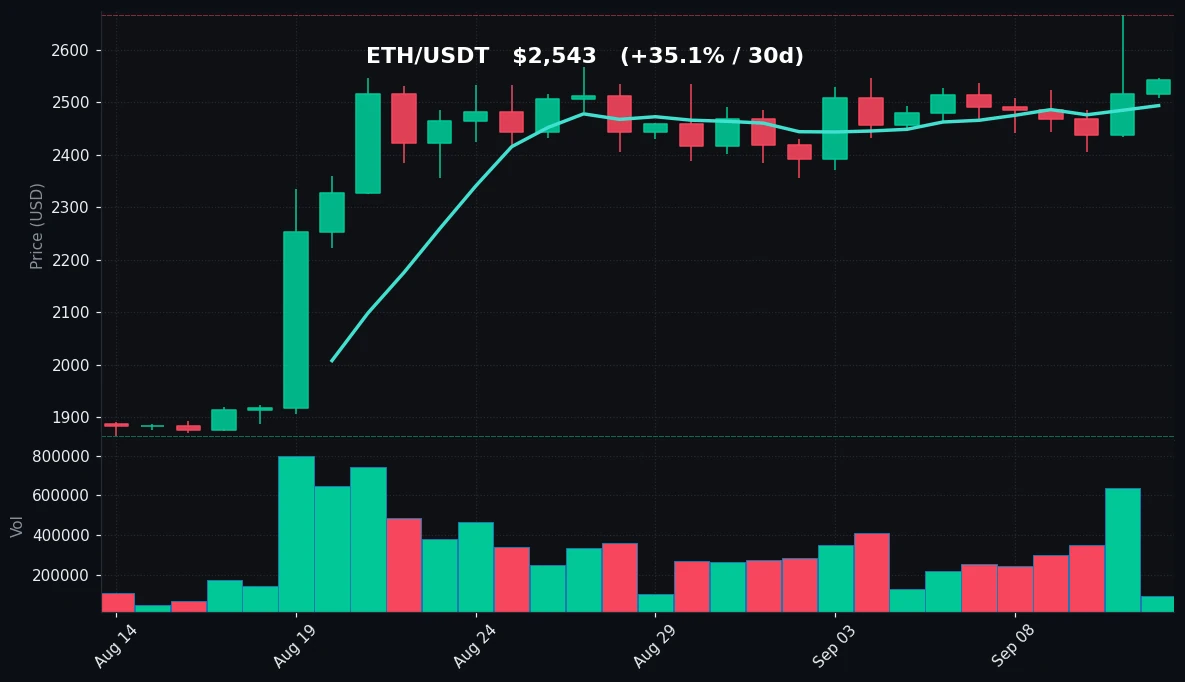
TradingView Live (4h)
Ethereum's chart is displaying a distinctly more constructive posture than Bitcoin's. At $2,543, ETH is up +1.04% on the day, +2.51% on the week, and +35.08% over 30 days. That 30-day figure is meaningfully stronger than BTC's +22.72%, and the price action confirms it: ETH's 30-day low of $1,864 to the 30-day high of $2,666 represents a range expansion of approximately 43%. Spot is currently just $123 below the 30-day high — roughly 4.6% off the peak — and notably, the 7-day high and 30-day high are the same value at $2,666, meaning ETH has not made a lower high over the past week.
The moving average structure is bullish. ETH trades at $2,543, above both the MA7 at $2,494 and the MA30 at $2,363. The margin over the MA7 is about $49 (roughly 2%), and the margin over the MA30 is about $180 (roughly 7.6%). Critically, the MA7 at $2,494 is itself above the MA30 at $2,363, producing a positive alignment — faster average above slower average, with price above both. This is the textbook configuration of an intact uptrend on the daily timeframe.
Support levels are well-defined. The first line sits at the MA7 around $2,494, which has acted as a dynamic floor during the recent advance. Below that, the 7-day low at $2,406 provides a secondary structural shelf. Deeper support rests at the MA30 near $2,363, and the 30-day low at $1,864 marks the base of the entire move. On the resistance side, the immediate ceiling is the $2,666 level — the shared 7-day and 30-day high. A sustained hold below that level keeps ETH in a consolidation beneath resistance; the level itself is the clear pivot the market is currently respecting.
Momentum is moderately positive. RSI(14) at 57.4 is above the 50 midline, indicating bullish momentum, but remains below the 70 threshold that would signal overbought conditions. This is a "constructive but not stretched" reading — there is room in the indicator before momentum becomes extended. Compared with BTC's 46.8, ETH's RSI is roughly 10.6 points higher, quantifying the relative strength gap between the two assets.
The volume dynamic deserves attention. ETH's turnover ran at just 0.3x the 7-day average — even thinner than BTC's 0.38x. Price appreciation on declining volume is a divergence worth flagging. It suggests the move higher is being driven by limited selling pressure rather than aggressive buying. In thin conditions, price can drift upward easily, but the lack of participation also means the move lacks broad confirmation. The fact that ETH is holding near weekly highs despite the volume vacuum is itself a mildly positive signal — sellers are simply not showing up — but it is not the same as a volume-backed breakout.
Net assessment: ETH's trend structure, moving average alignment, and RSI all lean constructive, with price consolidating just below the $2,666 resistance on light volume. The $2,494 MA7 is the first level to watch on any pullback.
Key Technical Levels
| Asset | Support | Resistance | RSI |
|---|---|---|---|
| BTC | $76,047 (7d low) / $75,529 (MA30) | $78,197 (MA7) / $80,560 (7d high) | 46.8 — neutral |
| ETH | $2,494 (MA7) / $2,406 (7d low) | $2,666 (7d & 30d high) | 57.4 — neutral |
BTC vs ETH Dynamic
Today's session shows a clear divergence in relative performance. ETH outperformed BTC on every comparable horizon: +1.04% vs +0.18% on the day, +2.51% vs -3.09% on the week, and +35.08% vs +22.72% over 30 days. The RSI spread — 57.4 for ETH against 46.8 for BTC — reinforces that ETH carries the stronger momentum profile, while BTC sits below its MA7 and ETH holds above its own. Both assets share the same liquidity condition, with volume at 0.3x and 0.38x of their respective 7-day averages, so the divergence is not a function of participation differences; it reflects genuine relative demand. In practice, the two remain directionally correlated over longer horizons, but the current rotation favors ETH on a relative-strength basis, with BTC consolidating beneath short-term resistance while ETH presses against its weekly high.
Strategy Fit
Today's conditions — compressed ranges, sub-average volume, mid-range RSI on both assets, and a shallow BTC pullback inside an uptrend — are characteristic of a consolidation regime rather than a trending one. That environment tends to favor range-aware approaches over momentum-chasing ones.
For BTC, the tight $77,164–$77,401 daily band and the well-defined $76,047 support / $78,197 resistance corridor create a bounded structure that suits grid-style strategies, which seek to capture oscillation between defined levels. For ETH, the trend alignment above both moving averages may suit trend-following or DCA approaches, though the thin volume argues for conservative position sizing either way. DCA remains a reasonable framework for participants with longer horizons who want to average through consolidation rather than time entries.
Pionex offers built-in bots that map directly to these conditions — grid trading bots for range-bound markets, DCA bots for gradual accumulation, and trend-following bots for directional setups. Because these tools execute mechanically, they can operate through low-volume chop without requiring active monitoring. Matching the bot type to the prevailing regime — grid in consolidation, DCA in accumulation, trend in expansion — is the practical takeaway from today's data.
Risk Disclaimer
This content is for informational purposes only and does not constitute financial, investment, or trading advice. Nothing here should be interpreted as a recommendation to buy, sell, or hold any asset. Cryptocurrency markets are highly volatile and can result in the total loss of capital. Technical levels, indicators, and strategy references are descriptive observations based on the data provided, not predictions of future price movement. Always conduct your own research and consult a qualified financial professional before making any investment decision.
FAQ
What price is Bitcoin trading at on 2026-09-12?
BTC is at $77,366, up +0.18% over 24 hours, with a daily range of $77,164 to $77,401.
How is Ethereum performing compared to Bitcoin today?
ETH is at $2,543, up +1.04% on the day, versus BTC's +0.18%. ETH is also stronger on the week (+2.51% vs -3.09%) and over 30 days (+35.08% vs +22.72%).
What do the RSI readings indicate?
BTC's RSI(14) is 46.8 and ETH's is 57.4. Both sit in neutral territory — BTC slightly below the 50 midline, ETH moderately above it — with neither asset overbought or oversold.
Why is volume significant in today's recap?
BTC volume is 0.38x its 7-day average and ETH is 0.3x. These sub-average readings indicate low conviction and thin participation, which is consistent with the compressed daily ranges on both assets.
What are the key levels to watch?
For BTC, support at $76,047 and $75,529 (MA30), resistance at $78,197 (MA7) and $80,560. For ETH, support at $2,494 (MA7) and $2,406, resistance at $2,666.


