BTC ETH Daily Recap — 2026-09-15

BTC ETH Daily Recap — 2026-09-15
Today at a Glance
Both major assets sit in mild pullback mode on the day, with Bitcoin printing $76,603 (-2.03% over 24 hours) and Ethereum at $2,454 (-2.45%). BTC's session range held between $78,250 and $76,123, while ETH traded from $2,520 down to $2,433. The more important context is the divergence in timeframe performance: over 30 days, BTC is up 18.70% and ETH up 28.24%, meaning today's weakness is a shallow retracement inside a larger advance rather than a trend reversal. Volume is notably light, with BTC at 0.65x and ETH at 0.59x their respective 7-day averages, suggesting sellers are not pressing with size. RSI(14) readings of 47.0 for BTC and 53.1 for ETH place both firmly in neutral territory, leaving room in either direction. BTC is trading just below its 7-day and 30-day moving averages, while ETH remains above both.
Bitcoin Analysis
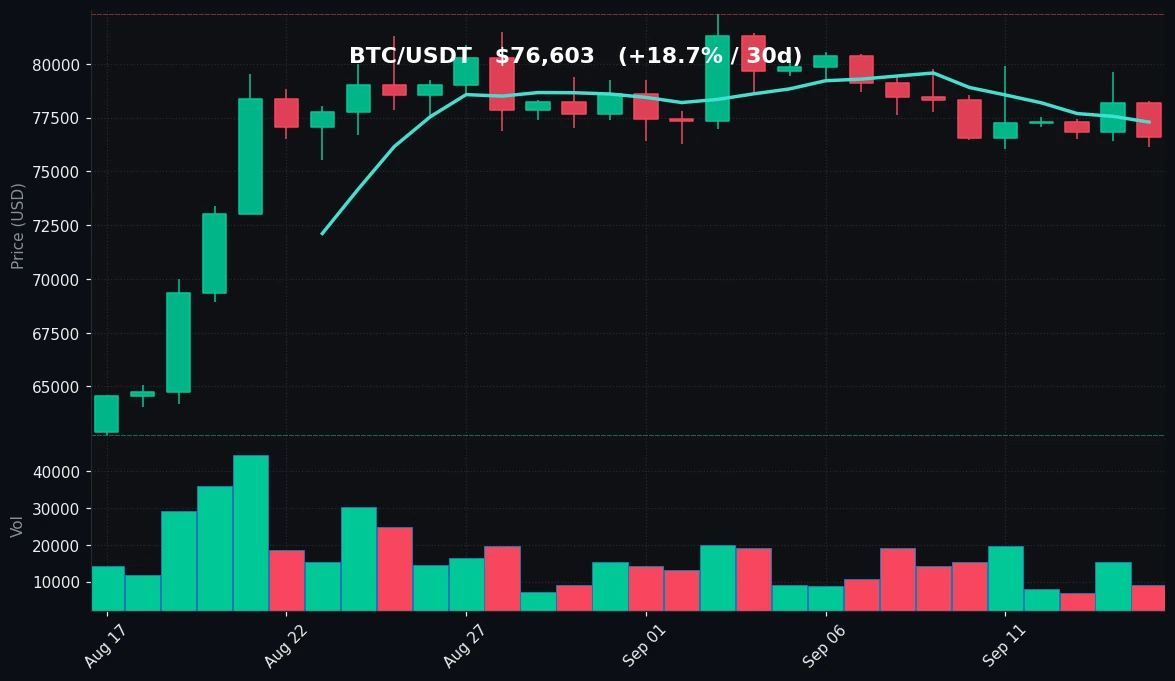
TradingView Live (4h)
Bitcoin enters the session at $76,603, down 2.03% over 24 hours and 2.36% over the past seven days, but still higher by 18.70% across the trailing 30 days. That combination frames the current move as a consolidation within a broader uptrend. The 24-hour range of $78,250 to $76,123 shows a relatively contained session, with the close nearer the lower end of the band. Over the past week, price has oscillated between $76,047 and $79,890, a roughly $3,800 range that defines the near-term battleground.
From a trend perspective, the moving average structure is worth examining closely. The MA7 sits at $77,288 and the MA30 at $76,946 — both above the current price of $76,603. That means BTC has slipped beneath both short- and medium-term averages, a configuration that typically signals near-term momentum has cooled. The two averages are also closely clustered, with the MA7 only about $342 above the MA30, indicating a flattening rather than a steeply trending structure. The 30-day high of $82,300 remains the reference point for the recent peak, while the 30-day low of $62,751 underscores how far the asset has traveled over the past month.
Momentum, as measured by RSI(14) at 47.0, is neutral. This reading sits just below the midpoint of the 30–70 band, confirming neither overbought nor oversold conditions. In the context of a 30-day gain of nearly 19%, an RSI in the high 40s suggests the recent pullback has worked off some of the upside pressure without triggering capitulation-style readings.
Volume is the standout detail. At 0.65x the 7-day average, participation is meaningfully below recent norms. Light volume on a down day is generally interpreted as a lack of aggressive selling rather than strong conviction to the downside. It also means the move carries less informational weight — thin markets can produce outsized price swings in either direction, and the absence of volume makes the current range less definitive.
On the levels that matter: the immediate zone to watch is the cluster around $76,900–$77,300 where both moving averages sit. A sustained reclaim of that band would put the 7-day high at $79,890 back into focus, with the 30-day high at $82,300 beyond it. To the downside, the 7-day low at $76,047 is the first structural reference, and it is only about $556 below the current price. A break beneath it would shift attention to the broader 30-day range. For now, the data describes a market digesting a strong monthly advance on light volume with neutral momentum.
Ethereum Analysis
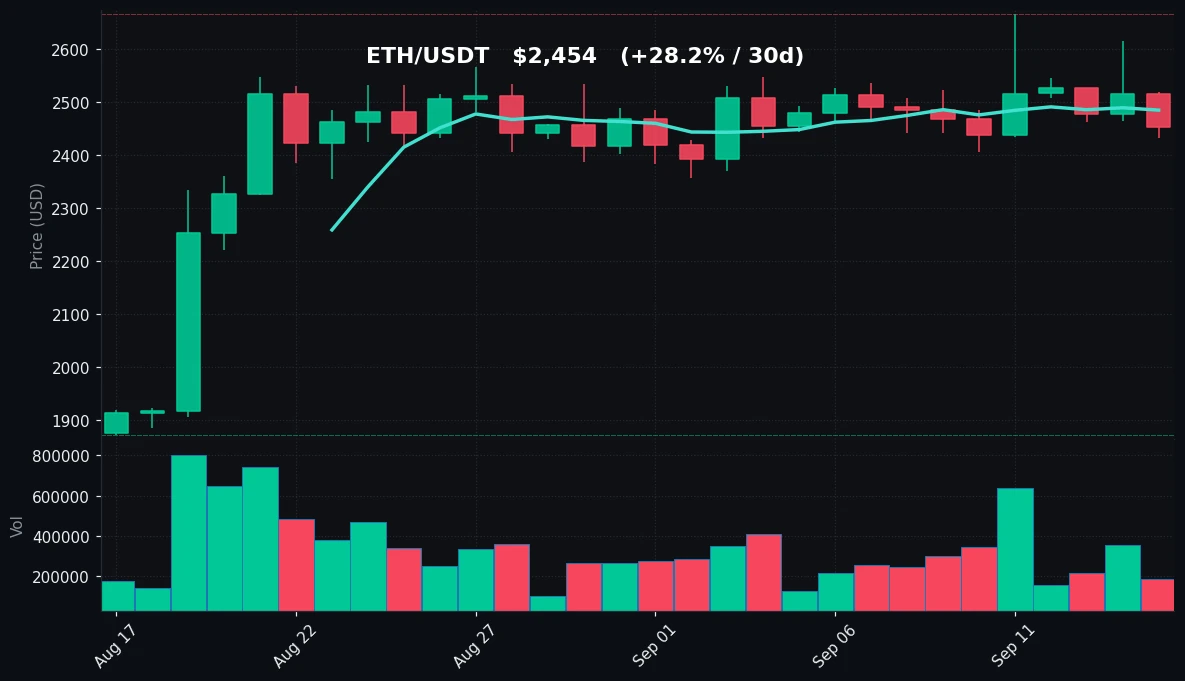
TradingView Live (4h)
Ethereum trades at $2,454, down 2.45% over 24 hours and 1.25% over seven days, but up a striking 28.24% over 30 days. The 24-hour range spanned $2,520 at the high to $2,433 at the low, placing the current price in the lower half of the session band. Over the past week, ETH has moved between $2,406 and $2,666 — a wide $260 range that reflects meaningful volatility relative to its price level.
The moving average picture for ETH is more constructive than BTC's. The MA7 at $2,485 and MA30 at $2,423 both sit below the 30-day performance trajectory but bracket the current price: ETH at $2,454 is below the MA7 by about $31 while remaining above the MA30 by roughly the same margin. This positioning — under the short-term average but over the medium-term average — is characteristic of a pullback within an intact intermediate uptrend. The MA7 being above the MA30 is a bullish alignment that has not yet been broken.
RSI(14) at 53.1 is neutral and slightly stronger than BTC's 47.0. Sitting modestly above the 50 midpoint, ETH's momentum reading suggests buyers retain a marginal edge despite the two-day softness. Notably, the 30-day high of $2,666 is identical to the 7-day high, which tells us ETH reached its monthly peak within the past week and has since retraced. The 30-day low of $1,872 highlights the scale of the rally — ETH has climbed more than 31% off that low.
Volume mirrors BTC's pattern: 0.59x the 7-day average, even lighter than Bitcoin's relative reading. Low-volume pullbacks after strong monthly gains are typically read as consolidation rather than distribution, though the reduced participation also means the current price discovery is less robust.
Key levels to monitor: the $2,423 MA30 is the nearest meaningful support beneath the market, followed by the 7-day low at $2,406 — a tight cluster that forms a defined support shelf around $2,406–$2,423. Holding that zone would keep the intermediate uptrend structure intact. To the upside, the $2,485 MA7 is the first hurdle, with the $2,666 7-day and 30-day high representing the ceiling of the recent range. ETH's larger 30-day gain and slightly firmer RSI suggest it has led the recent cycle, and today's pullback is proportionally similar to BTC's.
Key Technical Levels
| Asset | Support | Resistance | RSI |
|---|---|---|---|
| BTC | $76,047 (7d low) / $76,123 (24h low) | $77,288 (MA7) / $79,890 (7d high) | neutral (47.0) |
| ETH | $2,423 (MA30) / $2,406 (7d low) | $2,485 (MA7) / $2,666 (7d & 30d high) | neutral (53.1) |
BTC vs ETH Dynamic
BTC and ETH are moving in close lockstep today, with declines of 2.03% and 2.45% respectively — a spread of just 42 basis points, indicating highly correlated risk-off pressure across the two largest assets. The relationship holds over the week as well, with BTC down 2.36% and ETH down 1.25%, both negative but ETH showing relative resilience. The more telling divergence appears over 30 days: ETH's 28.24% gain comfortably outpaces BTC's 18.70%, a roughly 9.5 percentage point spread that suggests capital rotated toward ETH during the rally phase. ETH's RSI at 53.1 versus BTC's 47.0 reinforces that relative strength, as does ETH's position above its MA30 while BTC trades below both its averages. Both assets share the same low-volume signature, which points to a market-wide pause rather than asset-specific flows. The correlation remains tight enough that broad direction is likely to be driven by the same macro and liquidity factors for both.
Strategy Fit
Today's conditions — neutral RSI on both assets, sub-average volume, and prices oscillating inside well-defined weekly ranges — describe a range-bound, low-conviction tape rather than a strong trending environment. For BTC, the $76,047–$79,890 band and for ETH the $2,406–$2,666 band provide clear boundaries that range-oriented approaches are designed to navigate. Grid strategies, which place layered buy and sell orders within a defined range, tend to fit these conditions because they monetize oscillation without requiring a directional call. Dollar-cost averaging (DCA) may also suit participants focused on the longer 30-day uptrend, since it de-emphasizes entry timing during shallow pullbacks. Trend-following approaches, by contrast, typically need sustained directional momentum and expanding volume — neither of which is present at 0.65x and 0.59x relative volume. Pionex offers built-in bots that map directly to these conditions, including Grid Trading, DCA, and Rebalancing bots, allowing users to automate execution within self-defined parameters. Strategy selection should always reflect individual risk tolerance, capital, and time horizon rather than today's data alone.
Risk Disclaimer
This market recap is provided for informational purposes only and does not constitute financial, investment, or trading advice. It is not a recommendation to buy, sell, or hold any asset. Cryptocurrency markets are highly volatile and can result in the total loss of capital. Technical indicators and historical data do not guarantee future results. Always conduct your own research and consult a qualified financial professional before making any investment decision.
FAQ
What does BTC's RSI of 47.0 indicate?
An RSI(14) of 47.0 is neutral — below the 50 midpoint but well above the oversold threshold of 30 and far from overbought at 70. It suggests momentum has cooled without signaling extreme conditions.
Why is low volume significant today?
BTC volume is at 0.65x and ETH at 0.59x their 7-day averages. Light volume on a down move typically indicates limited selling pressure, but it also reduces the reliability of the price action as a signal.
Which levels matter most for ETH right now?
The $2,423 MA30 and $2,406 7-day low form the nearest support cluster, while the $2,485 MA7 and $2,666 recent high define overhead resistance.
How do BTC and ETH compare over 30 days?
BTC is up 18.70% and ETH up 28.24% over 30 days, showing ETH has outperformed. Today both are down, with ETH's RSI (53.1) slightly firmer than BTC's (47.0).
What strategies might suit current conditions?
With neutral momentum, tight ranges, and low volume, range-based approaches like grid strategies or gradual accumulation via DCA may align with the tape. Pionex provides built-in bots for these styles. This is not financial advice.


