BTC ETH Daily Recap — 2026-09-13

BTC ETH Daily Recap — 2026-09-13
Today at a Glance
Bitcoin and Ethereum both closed the session in the red, extending a mild corrective phase that has defined the past week. BTC traded at $76,867, down 0.53% over 24 hours, with an intraday range of $76,500 to $77,341. Over seven days, BTC has shed 4.32%, though it remains up a striking 21.85% over 30 days. Ethereum changed hands at $2,480, down 1.81% on the day, with a 24-hour range of $2,462 to $2,528. ETH is down a modest 1.36% on the week but up 31.75% over the month. Notably, both assets are trading on exceptionally thin volume — BTC at just 0.31x its 7-day average and ETH at 0.37x — a signature of a low-conviction, range-bound session. RSI readings sit in neutral territory: 46.9 for BTC and 55.6 for ETH.
Bitcoin Analysis
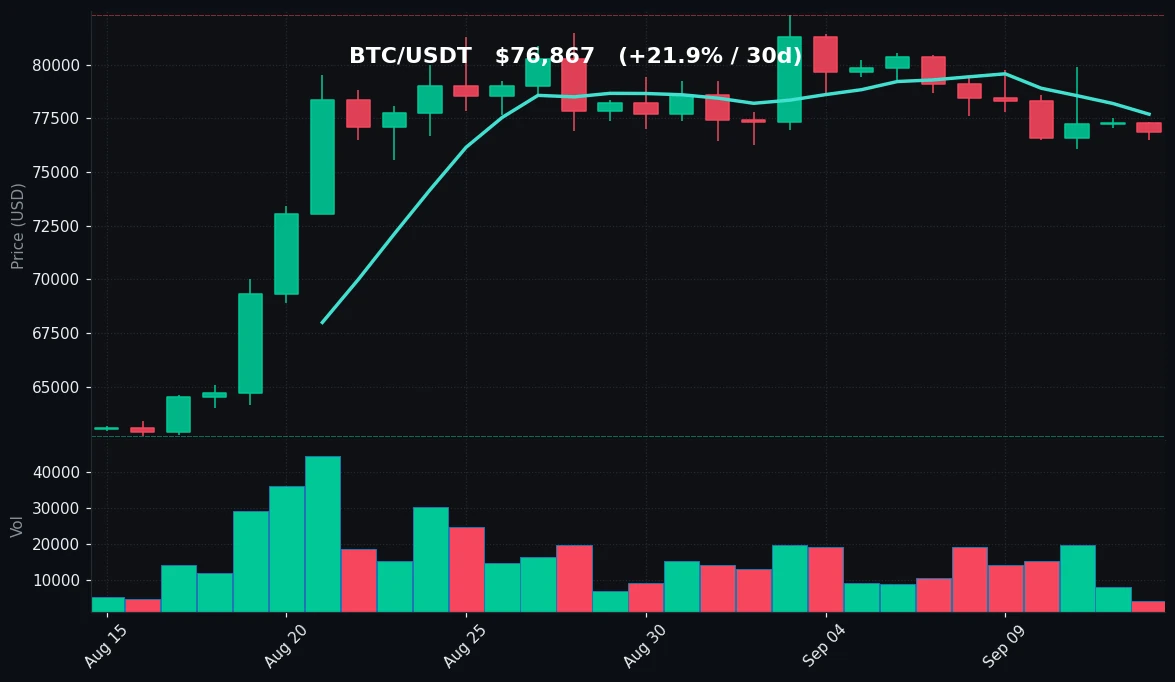
TradingView Live (4h)
Bitcoin's daily structure remains constructive on a medium-term basis even as short-term momentum cools. Price at $76,867 sits above the 30-day moving average of $75,986 but below the 7-day moving average of $77,688 — a configuration that typically signals a pause within a broader uptrend rather than a reversal. The 30-day low of $62,716 versus the 30-day high of $82,300 underscores the magnitude of the rally that preceded this pullback: a roughly 31% advance from trough to peak within a single month. The current consolidation is therefore best understood as digestion of prior gains rather than distribution.
On the weekly frame, BTC is down 4.32%, having printed a 7-day high of $80,444 and a low of $76,047. Today's action was compressed, with the entire 24-hour range spanning only about $841 — roughly 1.1% of spot price. That tightness, combined with the low realized volatility, suggests sellers are not aggressive; there is no evidence of panic liquidation. The nearest structural support zone lies around the 30-day moving average near $75,986, with a secondary floor near the weekly low of $76,047. A cluster of support between $75,900 and $76,050 is the level bulls would want to defend to keep the higher-low sequence intact. To the upside, initial resistance sits at the 7-day moving average of $77,688, followed by the weekly high at $80,444 and the 30-day peak at $82,300.
Volume is the most notable anomaly in today's data. At just 0.31x the 7-day average, participation is severely depressed. Low-volume pullbacks are generally considered less bearish than high-volume declines because they imply an absence of urgent selling rather than active supply. However, they also mean any directional move lacks confirmation — breakouts or breakdowns on such thin tape are prone to failure. RSI(14) at 46.9 is squarely neutral, sitting just below the 50 midline. This reading leaves ample room in either direction and confirms that momentum has cooled from the overbought conditions that likely accompanied the run to $82,300, without yet reaching oversold territory. Taken together, the data describe a market in equilibrium: a healthy uptrend on the monthly timeframe, a controlled pullback on the weekly, and a quiet, range-bound day with no decisive technical signal.
Ethereum Analysis
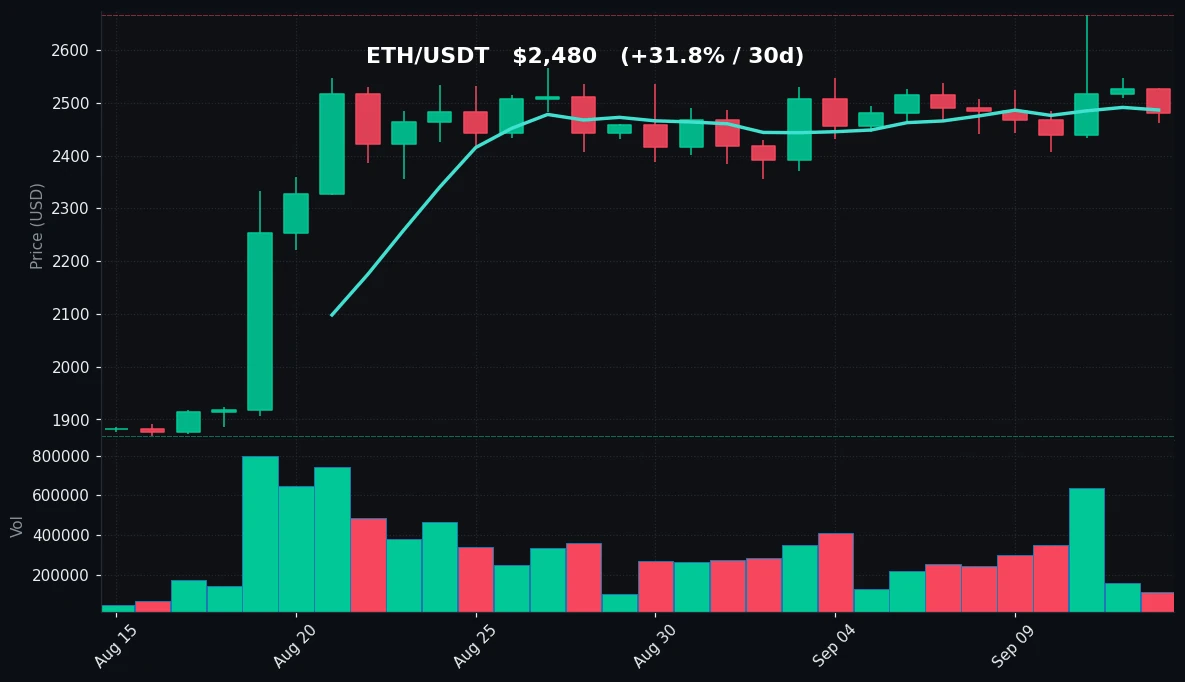
TradingView Live (4h)
Ethereum's picture is broadly similar to Bitcoin's but with a modestly stronger relative bid. At $2,480, ETH trades marginally below its 7-day moving average of $2,486 but comfortably above its 30-day moving average of $2,382 — the same "pullback within uptrend" alignment seen in BTC. The monthly gain of 31.75% is meaningfully larger than Bitcoin's 21.85%, and ETH's 30-day range ($1,869 to $2,666) reflects an even more dramatic recovery from its lows. The 30-day high of $2,666 also coincides exactly with the 7-day high, indicating that ETH's recent peak was set within the past week and that the current price is roughly 7% below that local top.
Today's session saw ETH decline 1.81%, underperforming BTC's 0.53% drop. The 24-hour range of $2,462 to $2,528 was relatively contained, though slightly wider in percentage terms than BTC's. On the week, ETH is down just 1.36% — less than half of Bitcoin's 4.32% decline — suggesting relative strength is accruing to the larger altcoin. The weekly low of $2,406 marks the first meaningful support shelf, followed by the 30-day moving average near $2,382. A deeper retracement would bring the $2,300–$2,350 region into focus, though nothing in the current data suggests that scenario is imminent. Resistance is clearly defined: the 7-day moving average at $2,486 is the immediate hurdle, with the $2,666 double-top from the weekly and monthly highs standing as the major ceiling.
RSI(14) at 55.6 is neutral-to-slightly-positive, notably firmer than BTC's 46.9. This divergence hints that ETH retains marginally better momentum despite today's larger percentage decline. Volume, however, mirrors Bitcoin's apathy: at 0.37x the 7-day average, ETH is also trading on very thin participation. As with BTC, this argues against reading today's move as a decisive bearish development. The structural takeaway is that ETH has held the bulk of its monthly advance, is consolidating above rising moving averages, and shows no technical breakdown. The key question for the sessions ahead is whether the $2,406 weekly low holds on any retest, and whether buyers can reclaim the $2,486 7-day average to re-establish short-term upward momentum.
Key Technical Levels
| Asset | Support | Resistance | RSI |
|---|---|---|---|
| BTC | $76,047 / $75,986 | $77,688 / $80,444 | neutral (46.9) |
| ETH | $2,406 / $2,382 | $2,486 / $2,666 | neutral (55.6) |
BTC vs ETH Dynamic
Bitcoin and Ethereum continue to move in broad lockstep, but the past week reveals a subtle performance gap. BTC's 7-day decline of 4.32% is more than triple ETH's 1.36% drop, and ETH's 30-day gain of 31.75% outpaces BTC's 21.85%. Both assets, however, share the same core characteristics today: neutral RSI readings, prices pinned between their 7-day and 30-day moving averages, and severely depressed volume (0.31x for BTC, 0.37x for ETH). This combination points to a market-wide pause rather than an asset-specific story — capital is neither rotating aggressively into alts nor fleeing to BTC. The high correlation means directional risk remains shared: a breakdown in BTC below $75,986 would likely drag ETH toward $2,382, while a BTC reclaim of $77,688 would probably lift ETH back above $2,486. ETH's relatively firmer RSI is a minor tell, but with volume this thin, it carries limited weight.
Strategy Fit
Today's market profile — compressed ranges, neutral RSI, and volume running at roughly one-third of the 7-day average — is classically range-bound. In such conditions, trend-following strategies tend to whipsaw, while mean-reversion approaches that harvest oscillation between defined support and resistance zones are structurally better aligned. For BTC, the relevant band spans roughly $76,000 to $77,700; for ETH, approximately $2,406 to $2,528. Grid trading strategies, which place layered buy and sell orders within a chosen range, are designed for precisely this kind of low-volatility chop, though traders should note that a decisive breakout above or below these bands would require the grid to be re-anchored. Dollar-cost averaging (DCA) remains a reasonable fit for longer-horizon participants given both assets are still in monthly uptrends, as it smooths entry across the current consolidation without requiring a directional call. Trend strategies have weaker justification today: the moving-average structure is bullish on the 30-day but bearish on the 7-day, and volume offers no confirmation either way. Platforms such as Pionex offer built-in bots — including grid and DCA configurations — that automate these approaches, allowing users to define ranges and intervals without manual order management. Regardless of tooling, position sizing should reflect the fact that thin volume can amplify slippage and false breaks.
Risk Disclaimer
This market recap is provided for informational purposes only and does not constitute financial, investment, or trading advice. The data and technical observations above describe past and current market conditions; they are not predictions of future price movement. Cryptocurrency markets are highly volatile and can result in the total loss of capital. Always conduct your own research and consult a qualified financial professional before making any investment decision.
FAQ
What was Bitcoin's price on 2026-09-13?
BTC traded at $76,867, down 0.53% over 24 hours, with a daily range of $76,500 to $77,341.
How did Ethereum perform today?
ETH was at $2,480, down 1.81% on the day, within a 24-hour range of $2,462 to $2,528.
Are BTC and ETH overbought or oversold?
Neither. BTC's RSI(14) is 46.9 and ETH's is 55.6 — both in neutral territory.
What are the key support and resistance levels?
BTC support sits near $76,047–$75,986 with resistance at $77,688 and $80,444. ETH support is around $2,406–$2,382 with resistance at $2,486 and $2,666.
Why is today's volume so low?
BTC volume is 0.31x and ETH volume is 0.37x their respective 7-day averages, indicating low conviction and a range-bound session with no decisive directional flow.


