BTC ETH Daily Recap — 2026-09-18

BTC ETH Daily Recap — 2026-09-18
Today at a Glance
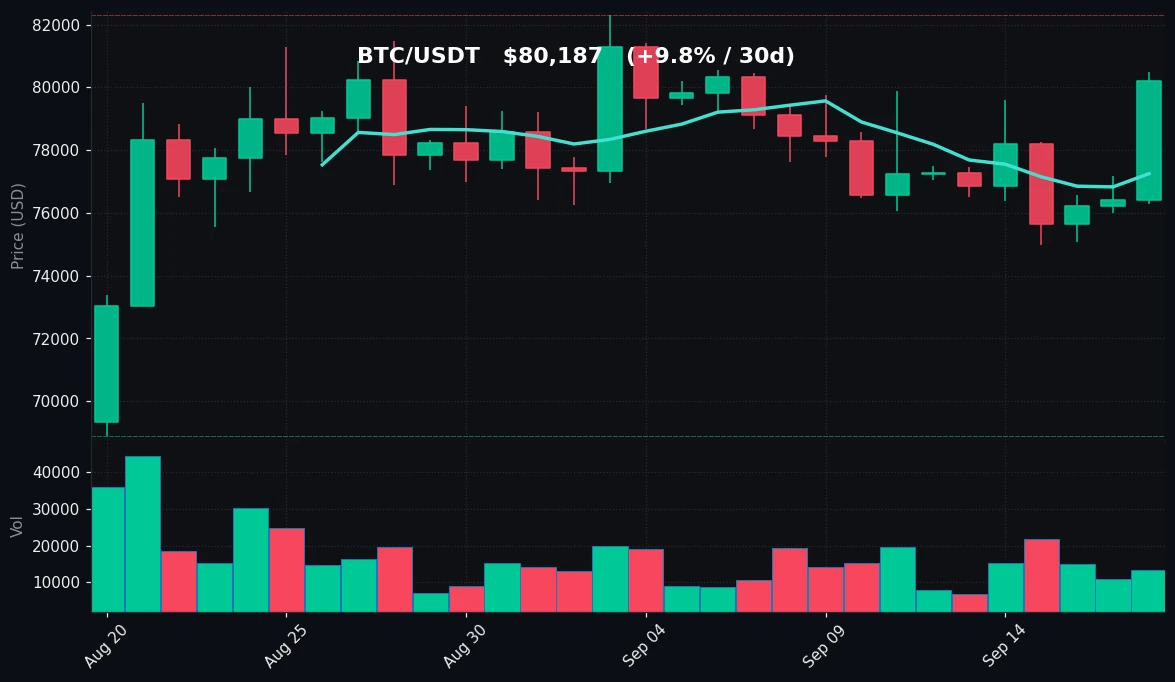
Bitcoin closed the session at $80,187, up 4.93% over 24 hours, after trading in a $76,296–$80,500 range. The move pushed BTC back above both its 7-day moving average ($77,252) and 30-day moving average ($78,054), a meaningful structural shift after a week of chop. The 7-day gain stands at 3.84% and the 30-day at 9.81%, with price now roughly 2.6% below the 30-day high of $82,300.
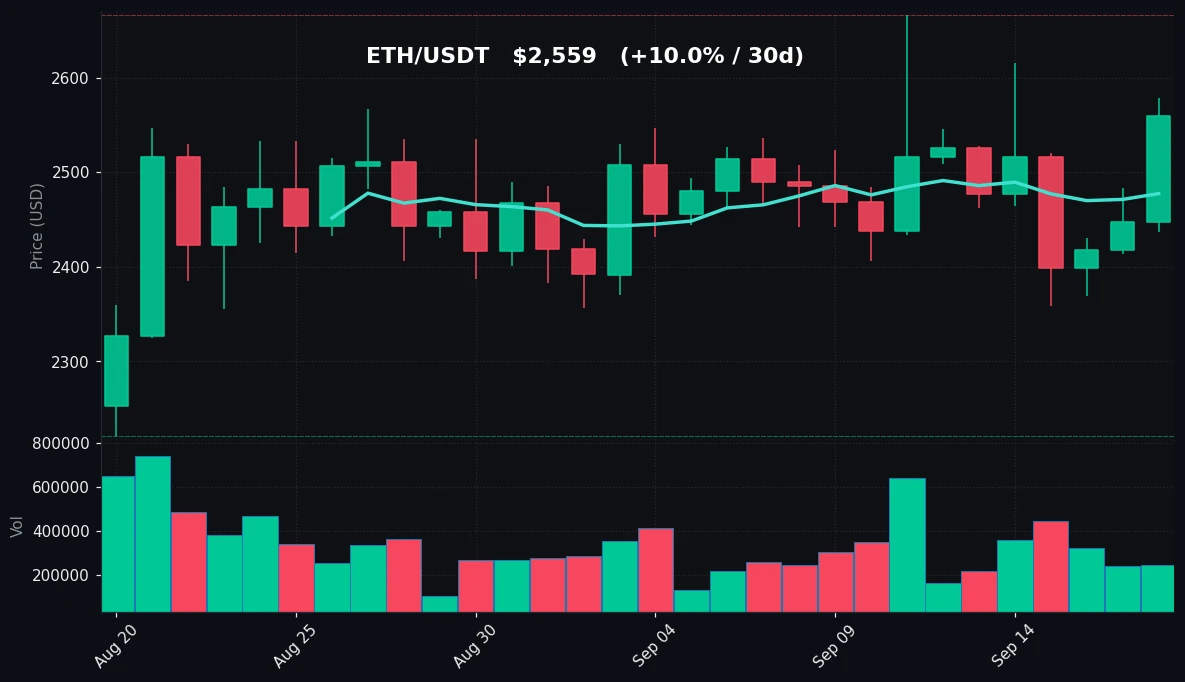
Ethereum followed with a 4.56% daily advance to $2,559, trading between $2,437 and $2,578. ETH is now above its MA7 ($2,477) and MA30 ($2,466), with a 30-day gain of 9.98% that edges out BTC's. Notably, ETH's 24-hour volume came in at 0.72x its 7-day average, while BTC's registered 0.95x — both below average, suggesting the rally was driven by thinner flow rather than broad participation.
Bitcoin Analysis
TradingView Live (4h)
Bitcoin's session was defined by a decisive reclaim of the moving average cluster. Entering the day, price had been oscillating below the MA7 and MA30, which sat at $77,252 and $78,054 respectively. The 4.93% advance carried price through both levels and left BTC holding above them into the close at $80,187 — a position it had not maintained consistently over the prior week.
The immediate technical reference is the 24-hour high of $80,500, which also marks the 7-day high. Price closed just $313 below that ceiling, meaning the rally stalled at a level that has already rejected it once this week. Above that, the 30-day high of $82,300 is the next structural reference — roughly 2.6% above the current close. On the downside, the reclaimed MA30 at $78,054 is the first level of interest, followed by the MA7 at $77,252. The 7-day low of $74,968 and the 24-hour low of $76,296 define the lower boundary of the recent range; the 30-day low of $68,902 remains the deeper support reference.
Momentum is neutral, not extended. RSI(14) at 51.9 sits almost exactly at the midpoint, which is notable given the size of the daily candle. A 4.93% move that leaves RSI near 50 indicates the indicator is recovering from a previously weak reading rather than confirming an overbought condition. There is substantial headroom before RSI would approach levels typically associated with exhaustion.
Volume is the caveat. At 0.95x the 7-day average, participation was marginally below normal. A breakout of this magnitude on below-average volume carries less confirmation than one on expanding flow, and it leaves the move more vulnerable to reversal if follow-through does not materialize. The combination of a strong price candle, neutral RSI, and sub-average volume describes a market that has improved structurally but has not yet demonstrated broad conviction.
Ethereum Analysis
TradingView Live (4h)
Ethereum's 4.56% gain to $2,559 carried ETH above both its MA7 ($2,477) and MA30 ($2,466), completing the same moving-average reclaim seen in BTC. The two averages are separated by only $11, which reflects a compressed, range-bound structure over the past month rather than a strongly trending one. Price now sits about $92 above the MA30, a modest but positive buffer.
The 24-hour high of $2,578 is the nearest resistance and sits just below the 7-day high of $2,615. That $2,615 level is the more significant reference, as it represents the ceiling of the past week's range. Beyond it, the 30-day high of $2,666 — roughly 4.2% above the current price — marks the upper bound of the monthly structure. On the downside, the MA7 at $2,477 and MA30 at $2,466 form a tight support band, below which the 24-hour low of $2,437 and the 7-day low of $2,359 come into view. The 30-day low of $2,222 is the deeper floor.
RSI(14) at 58.8 is the more constructive reading of the two majors. It sits in mildly positive territory without approaching overbought conditions, and it is meaningfully higher than BTC's 51.9 despite ETH's smaller daily percentage gain. This suggests ETH's momentum base was stronger coming into the session, consistent with its slightly larger 30-day return of 9.98% versus BTC's 9.81%.
The volume picture is the notable divergence. ETH traded at 0.72x its 7-day average — the lowest relative participation of the two assets and a clear sign that the advance was not driven by aggressive accumulation. ETH's 30-day range from $2,222 to $2,666 is roughly 20% wide, and price is currently in the upper-middle portion of that band. With RSI neutral-positive and volume light, the technical setup is one of improving structure on weak confirmation.
Key Technical Levels
| Asset | Support | Resistance | RSI |
|---|---|---|---|
| BTC | $78,054 (MA30) / $77,252 (MA7) | $80,500 (24h & 7d high) / $82,300 (30d high) | neutral (51.9) |
| ETH | $2,477 (MA7) / $2,466 (MA30) | $2,578 (24h high) / $2,615 (7d high) | neutral (58.8) |
BTC vs ETH Dynamic
BTC and ETH moved in close alignment today, posting gains of 4.93% and 4.56% respectively — a spread of under 40 basis points. Both assets reclaimed their MA7 and MA30 on the same session, and both closed below their respective 24-hour highs, indicating a shared intraday pattern of advance followed by mild fade. The correlation is reinforced by the volume profile: both traded below their 7-day averages (BTC at 0.95x, ETH at 0.72x), suggesting the same macro flow — or lack thereof — affected both markets. The one meaningful divergence is momentum: ETH's RSI at 58.8 sits nearly seven points above BTC's 51.9, and ETH's 30-day return of 9.98% slightly exceeds BTC's 9.81%. Over the past month, ETH has been the marginally stronger performer, though the difference is small enough that neither asset is demonstrating clear leadership. For now, the pair is trading as a single risk unit rather than two independent setups.
Strategy Fit
Today's conditions — neutral RSI on both majors, price reclaiming moving averages, and below-average volume — describe a market that has shifted range boundaries without confirming a sustained trend. BTC's 30-day range spans $68,902 to $82,300, and ETH's spans $2,222 to $2,666; both remain wide relative to current daily movement, which keeps mean-reversion conditions relevant. A grid strategy, which profits from oscillation within a defined band, is structurally suited to this kind of environment where price is advancing but volume is not confirming a breakout. Pionex offers built-in grid trading bots that automate buy and sell orders across a set range, which can be configured around the support and resistance levels identified above.
For participants with a longer horizon and no view on near-term direction, DCA remains a straightforward approach to accumulating through volatility without timing entries. A trend-following strategy has weaker justification today: the moving-average reclaim is a positive signal, but sub-average volume and neutral RSI do not yet constitute the sustained momentum that trend systems typically require for confirmation. Pionex's built-in bot suite covers grid, DCA, and trend-oriented configurations, allowing the strategy to be matched to the current regime rather than applied uniformly.
Risk Disclaimer
This article is for informational purposes only and does not constitute financial, investment, or trading advice. Cryptocurrency markets are highly volatile and can result in the loss of all invested capital. Technical levels, indicators, and strategy descriptions referenced above are observations of historical data, not recommendations or predictions. Past performance is not indicative of future results. Readers should conduct their own research and consult a qualified financial professional before making any trading decisions. Any mention of specific platforms or tools is descriptive and not an endorsement.
FAQ
What drove Bitcoin's 4.93% gain on 2026-09-18?
BTC advanced from a 24-hour low of $76,296 to close at $80,187, reclaiming both its MA7 ($77,252) and MA30 ($78,054). Volume was 0.95x the 7-day average, so the move occurred on slightly below-average participation.
Is Bitcoin overbought after this move?
No. BTC's RSI(14) stands at 51.9, which is neutral and close to the midpoint. A reading near 50 after a 4.93% daily gain indicates momentum is recovering rather than extended.
How did Ethereum perform relative to Bitcoin?
ETH rose 4.56% to $2,559 versus BTC's 4.93%. ETH's RSI of 58.8 is higher than BTC's 51.9, and its 30-day return of 9.98% slightly exceeds BTC's 9.81%.
What are the key levels to watch for BTC and ETH?
For BTC, support sits at $78,054 and $77,252, with resistance at $80,500 and $82,300. For ETH, support is at $2,477 and $2,466, with resistance at $2,578 and $2,615.
Why does below-average volume matter in this context?
Both assets traded under their 7-day volume averages (BTC 0.95x, ETH 0.72x). Breakouts on light volume carry weaker confirmation, meaning the moving-average reclaims have less validation from participation than a high-volume move would provide.


