BTC ETH Daily Recap — 2026-09-19

BTC ETH Daily Recap — 2026-09-19
Today at a Glance
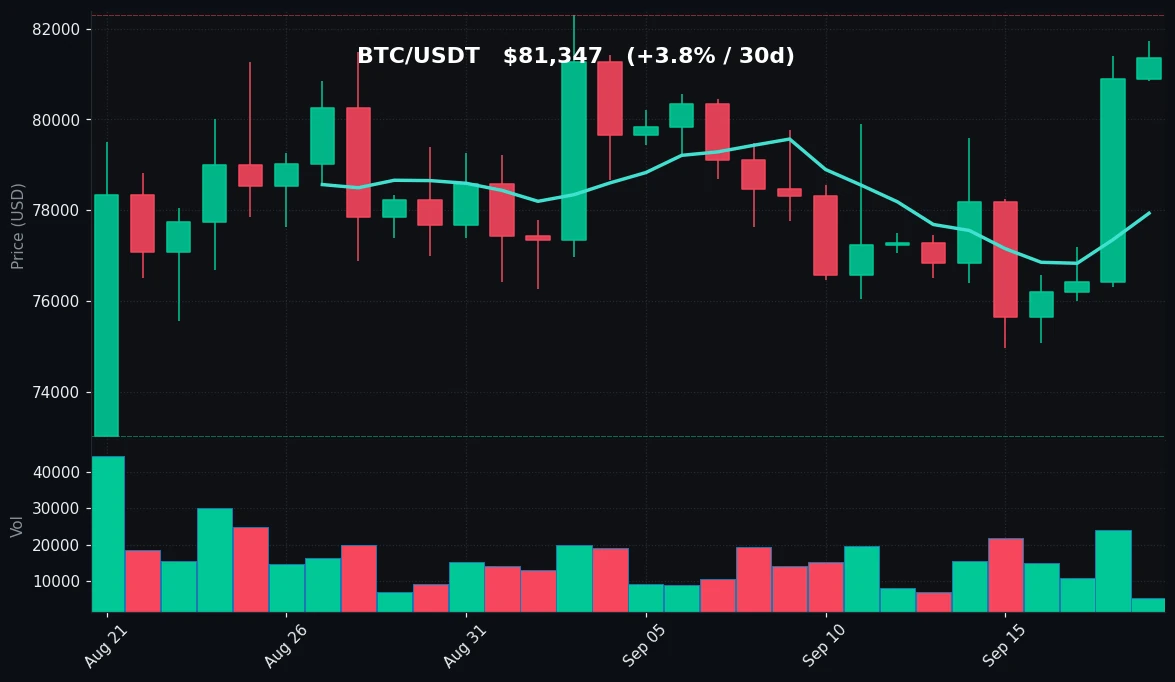
Bitcoin closed the session at $81,347, up 0.57% over 24 hours, trading inside a tight $896 range between $80,845 and $81,741. The move extends a constructive week: BTC is +5.26% over seven days and +3.84% over 30 days, with the 7-day high of $81,741 printed today and the 30-day high of $82,300 still overhead. Price is holding well above both the MA7 ($77,933) and MA30 ($78,355), confirming a short-term uptrend structure. Momentum is moderate, with RSI(14) at 55.0 — neither stretched nor weak. Volume is the notable caveat: turnover is running at just 0.37x the 7-day average, meaning the advance is occurring on thin participation.
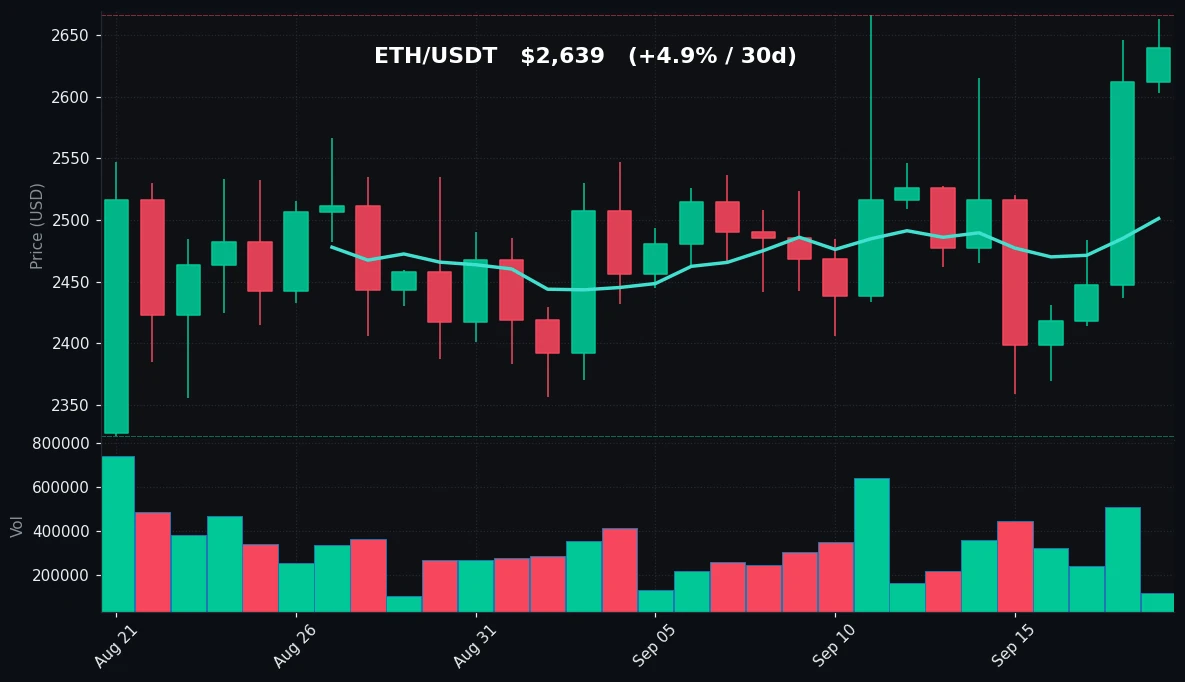
Ethereum outperformed on the day, gaining 1.03% to $2,639 while also setting a fresh 7-day high of $2,663. ETH is +4.48% weekly and +4.88% monthly, trading above MA7 ($2,501) and MA30 ($2,478). RSI(14) at 62.3 is firmer than BTC's, though volume is similarly light at 0.36x the 7-day average. Both majors are trending up on declining participation — a configuration that favors level-watching over chasing.
Bitcoin Analysis
TradingView Live (4h)
Bitcoin's trend remains constructive across all three tracked horizons. The +0.57% daily gain, +5.26% weekly move, and +3.84% monthly advance describe a market that has recovered from the lower end of its 30-day range ($73,027) and is now pressing against the upper boundary. The 7-day low of $74,968 and 30-day low of $73,027 frame the base that has held through the period, while the sequence of higher closes into the weekend suggests buyers remain in control of the immediate tape.
On the technical side, the most important structural fact is that price ($81,347) sits comfortably above both moving averages. MA7 at $77,933 and MA30 at $78,355 are clustered within roughly $400 of each other, and spot is trading about 4.4% above the 7-day average and 3.8% above the 30-day average. That spread indicates an extended-but-not-exhausted posture: the short-term trend has pulled ahead of the intermediate trend without breaking it. The MA7/MA30 relationship itself is essentially flat-to-positive, with the 7-day average marginally below the 30-day — a configuration that typically resolves as either a fresh cross higher or a mean-reversion test of the $78,000 zone. Notably, the $78,000–$78,400 area now represents the first meaningful support shelf, formed by the convergence of both averages.
Resistance is clearly defined. Today's high of $81,741 is the immediate ceiling, and the 30-day high of $82,300 sits just above it — a level that has capped price once already this month. A daily close above $82,300 would mark a fresh 30-day range breakout; failure there keeps BTC in the $73,000–$82,300 consolidation that has defined the past month. Support below the moving averages rests at the 7-day low of $74,968, with the 30-day low of $73,027 as the range floor.
Momentum is neutral. RSI(14) at 55.0 is almost exactly the midpoint of the 30–70 band, implying no overbought pressure and no oversold cushion. In practical terms, there is room in either direction before momentum becomes a constraint. The bigger story is volume: at 0.37x the 7-day average, participation is roughly one-third of the recent norm. Low-volume advances are less reliable than high-volume ones, and the combination of a multi-day rally with shrinking turnover argues for treating the move as a drift higher rather than a demand-driven breakout. Until volume expands, the $81,741–$82,300 band and the $78,000 support shelf are the two zones that matter most.
Ethereum Analysis
TradingView Live (4h)
Ethereum's structure mirrors Bitcoin's but with slightly stronger momentum characteristics. ETH closed at $2,639, up 1.03% on the day, and printed a 7-day high of $2,663 — also just shy of the 30-day high of $2,666. The weekly gain of +4.48% and monthly gain of +4.88% are both modestly ahead of BTC's equivalent figures, continuing the recent pattern of ETH outperforming at the margin. The 7-day low of $2,359 and 30-day low of $2,325 mark the base from which this leg originated, and the recovery from those levels has been consistent rather than impulsive.
The moving average picture is supportive and slightly tighter than BTC's. MA7 at $2,501 and MA30 at $2,478 are separated by only about $23, and spot is trading roughly 5.5% above the 7-day average and 6.5% above the 30-day. That is a wider premium to trend than BTC carries, which cuts two ways: it confirms relative strength, but it also means ETH is more extended relative to its own averages. The $2,478–$2,501 zone is the immediate support shelf; a pullback into it would be a normal mean-reversion test rather than a trend break. Below that, the 7-day low of $2,359 is the next structural reference.
Resistance is unusually well-defined. Today's high of $2,663 and the 30-day high of $2,666 are effectively the same level — a double top within $3. This is the clearest technical decision point on the ETH chart: a close above $2,666 opens the door to range expansion, while repeated rejections there reinforce it as the ceiling of the current 30-day range ($2,325–$2,666). The fact that ETH has now tagged this zone from below after a 4.5% weekly rally makes it the single most important level to monitor.
RSI(14) at 62.3 is firmer than BTC's 55.0 and sits in the upper-neutral region. It is not overbought — the 70 threshold remains some distance away — but it does indicate that ETH has absorbed more of its recent buying pressure than BTC has. As with Bitcoin, volume is the weak link: 0.36x the 7-day average means this rally to the range highs is happening on light turnover. ETH's relative momentum strength is real, but it is not yet confirmed by participation, and the $2,663–$2,666 resistance band is where that tension will resolve.
Key Technical Levels
| Asset | Support | Resistance | RSI |
|---|---|---|---|
| BTC | $78,000–$78,400 (MA7/MA30 cluster); secondary $74,968 | $81,741 (today's high); key $82,300 (30d high) | 55.0 — neutral |
| ETH | $2,478–$2,501 (MA7/MA30 cluster); secondary $2,359 | $2,663–$2,666 (7d high / 30d high) | 62.3 — neutral (upper half) |
BTC vs ETH Dynamic
BTC and ETH are moving in the same direction with highly correlated daily behavior — both up modestly on the day (+0.57% and +1.03%), both up mid-single-digits on the week and month, and both printing 7-day highs within their respective sessions. The divergence is one of degree rather than direction: ETH carries the higher RSI (62.3 vs 55.0), the larger premium to its moving averages (~5.5% vs ~4.4% above MA7), and the marginally stronger weekly and monthly performance. Both, however, share the same volume signature — roughly one-third of the 7-day average — which suggests the correlation is being driven by a common, low-conviction macro flow rather than asset-specific catalysts. The practical implication is that ETH is the higher-beta expression of the same trade: it will likely lead on the upside if the $2,666 and $82,300 resistances break, and it will likely give back more if the $2,478–$2,501 and $78,000–$78,400 support shelves are tested.
Strategy Fit
Today's tape presents a specific profile: established uptrends, price above both moving averages, neutral RSI readings, well-defined horizontal resistance, and volume at roughly a third of the 7-day norm. Low-volume, range-bound-to-gently-trending conditions with clear boundaries tend to favor systematic approaches over discretionary chasing. Grid strategies are structurally suited to this environment because they monetize oscillation between defined levels — for BTC, the $78,000–$82,300 band, and for ETH, the $2,478–$2,666 band — without requiring a breakout to occur. DCA remains a reasonable fit for longer-horizon accumulation given that both assets are above their 30-day averages but not overbought, allowing entries to be spread across the range rather than concentrated at the highs. Trend-following has a weaker case today specifically because volume is not confirming the advance; trend strategies typically want expanding participation, and 0.36x–0.37x relative volume does not provide that.
For traders who prefer to run these approaches without manual execution, Pionex offers built-in bots that map directly to these conditions — grid bots for the range-bound structure, DCA bots for staggered accumulation, and trend-oriented bots for those positioning ahead of a potential range break. Parameters should be set with the levels in this report in mind: range boundaries at the support and resistance zones above, and position sizing that respects the low-liquidity environment.
Risk Disclaimer
This article is for informational purposes only and does not constitute financial, investment, or trading advice. Cryptocurrency markets are highly volatile and can result in the loss of all invested capital. The data and levels discussed reflect conditions as of 2026-09-19 and may change rapidly. No price predictions are made or implied. Readers should conduct their own research, consider their personal risk tolerance, and consult a qualified professional before making any trading decisions. Past performance is not indicative of future results.
FAQ
What was Bitcoin's price on 2026-09-19?
BTC/USDT closed at $81,347, up 0.57% over 24 hours, with a daily range of $80,845 to $81,741.
What was Ethereum's price on 2026-09-19?
ETH/USDT closed at $2,639, up 1.03% over 24 hours, with a daily range of $2,603 to $2,663.
Which asset performed better, BTC or ETH?
ETH outperformed on every tracked horizon: +1.03% vs +0.57% daily, +4.48% vs +5.26% weekly (BTC led weekly), and +4.88% vs +3.84% monthly. ETH also carried the higher RSI at 62.3 versus BTC's 55.0.
What are the key levels to watch?
For BTC, resistance sits at $81,741 and the 30-day high of $82,300, with support at the MA7/MA30 cluster around $78,000–$78,400. For ETH, resistance is $2,663–$2,666 and support is the MA cluster at $2,478–$2,501.
Why is low volume important in this recap?
BTC and ETH are both trading at roughly 0.36x–0.37x their 7-day average volume. Low-volume advances carry less confirmation than high-volume ones, which is why the current structure is described as a drift higher within defined ranges rather than a confirmed breakout.


