BTC ETH Daily Recap — 2026-09-16

BTC ETH Daily Recap — 2026-09-16
Today at a Glance
Bitcoin is trading at $75,558, essentially flat over the past 24 hours at -0.11%, but the broader picture shows a market in consolidation rather than expansion. The session range was tight — a high of $76,304 against a low of $75,350 — and volume came in at just 0.47x the 7-day average, a clear sign that participation has thinned out. Over seven days, BTC is down 3.51%, though the 30-day view remains firmly positive at +16.74%. Ethereum mirrors this tone: $2,390 on the day, -0.35%, with a 24-hour range of $2,430 to $2,383 and volume at only 0.37x its 7-day average. ETH is -3.17% on the week but +24.61% over 30 days. Both assets sit below their short-term moving averages, and both have cooled from recent highs — BTC's 7-day peak of $79,890 and ETH's $2,666 — suggesting a pause within a larger uptrend rather than a reversal.
Bitcoin Analysis
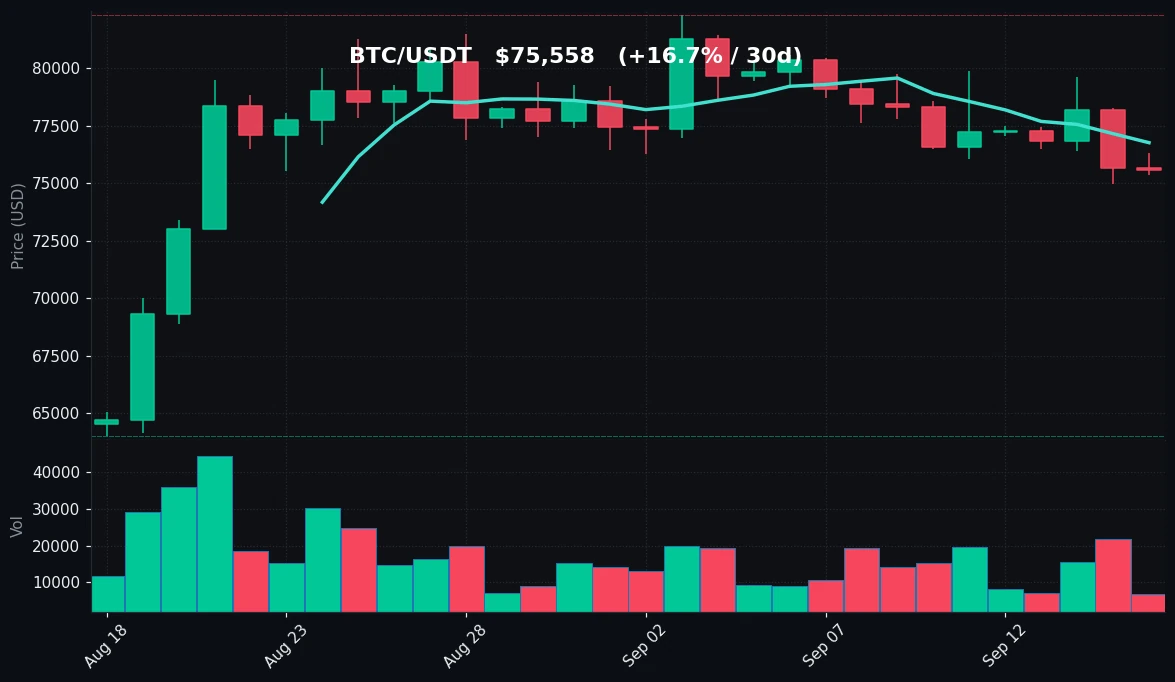
TradingView Live (4h)
Bitcoin's daily structure on 2026-09-16 shows a market digesting a strong monthly advance. Price at $75,558 sits below both the MA7 at $76,758 and the MA30 at $77,281, meaning short-term momentum has rolled over even as the 30-day change of +16.74% confirms the medium-term trend remains constructive. The relationship between the two averages is worth noting: the MA7 has slipped beneath the MA30, a configuration typical of corrective phases following extended rallies. That said, the gap between them is narrow — roughly $523 — indicating this is a shallow pullback rather than a decisive trend break.
On the levels that matter, the immediate floor is the 7-day low at $74,968, which also sits just below today's session low of $75,350. A hold above this zone keeps the 30-day base at $64,028 comfortably distant and preserves the higher-low structure established over the past month. To the upside, the first meaningful hurdle is the MA7/MA30 cluster between $76,758 and $77,281. Reclaiming that band would put the 7-day high of $79,890 back in play, with the 30-day high at $82,300 as the broader ceiling.
Volume is the standout data point today. At 0.47x the 7-day average, activity is roughly half of what has been typical this week. Low-volume pullbacks are generally interpreted as a lack of aggressive selling rather than the emergence of strong supply — sellers are not pressing, but buyers are also not stepping in with conviction. This often precedes a resolution in either direction once volume returns.
RSI(14) at 44.1 places Bitcoin in neutral territory, leaning toward the cooler half of the range. It is neither oversold nor overbought, which is consistent with a market that has worked off overbought conditions from the run to $82,300 without triggering panic selling. The combination of sub-average volume, a neutral RSI, and price holding above the 7-day low describes a classic consolidation. The 24-hour change of -0.11% reinforces how balanced the order flow has been. For now, the technical picture is one of digestion: the monthly trend is intact, the weekly trend is soft, and the daily tape is quiet.
Ethereum Analysis
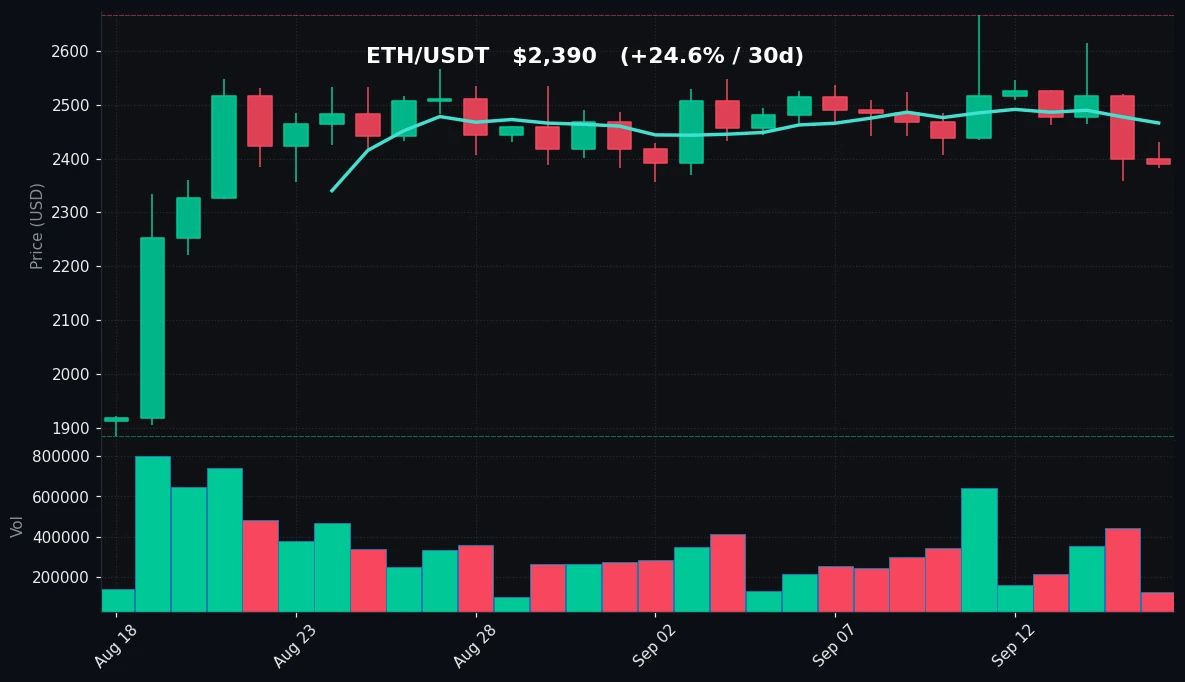
TradingView Live (4h)
Ethereum is trading at $2,390, down 0.35% over 24 hours, with a session range of $2,430 to $2,383. The weekly change of -3.17% closely tracks Bitcoin's -3.51%, but ETH's 30-day performance of +24.61% outpaces BTC's +16.74% — a reminder that Ethereum has been the higher-beta expression of this market cycle over the past month. Its 30-day low of $1,886 against a 30-day high of $2,666 represents a notably wide range, underlining the volatility that has accompanied the advance.
Technically, ETH is in a similar position to BTC but with a slightly different moving-average configuration. Price at $2,390 sits below the MA7 at $2,466 and just below the MA30 at $2,437. Unlike Bitcoin, the MA7 remains above the MA30 — the gap is roughly $29 — which suggests the short-term trend has not yet crossed beneath the medium-term trend. ETH is, however, testing that MA30 from above, making $2,437 a level to watch for signs of stabilization or further slippage.
The 7-day low at $2,359 is the nearest support and sits just below today's low of $2,383. Below that, the structural floor from the 30-day range is $1,886, though that is far from current price. On the resistance side, the MA7 at $2,466 is the first obstacle, followed by the 7-day high of $2,666 — which is also the 30-day high, meaning ETH's recent peak coincides across both windows. That double-top reference at $2,666 marks the level bulls would need to clear to reassert momentum.
Volume at 0.37x the 7-day average is even lighter than Bitcoin's, indicating that ETH's pullback is occurring on particularly thin participation. RSI(14) at 49.8 is almost perfectly neutral — the midpoint of the range — reflecting a market with no clear directional bias on the daily timeframe. The 24-hour decline of 0.35% is modest, and the tight session range of $47 suggests neither buyers nor sellers are in control. Ethereum's setup is best described as a pause at the MA30 within a still-positive monthly trend.
Key Technical Levels
| Asset | Support | Resistance | RSI |
|---|---|---|---|
| BTC | $74,968 | $76,758 | neutral |
| ETH | $2,359 | $2,466 | neutral |
BTC vs ETH Dynamic
Bitcoin and Ethereum are moving in near-lockstep today, with BTC at -0.11% and ETH at -0.35% over 24 hours and weekly declines of -3.51% and -3.17% respectively. The correlation is evident not just in direction but in character: both are consolidating below their short-term moving averages, both are printing volume well below their 7-day averages (0.47x for BTC, 0.37x for ETH), and both show neutral RSI readings (44.1 and 49.8). The main divergence is in magnitude over the 30-day window, where ETH's +24.61% outstrips BTC's +16.74%, consistent with ETH's wider 30-day range and higher beta. Today, however, that beta is not expressing itself — ETH's slightly larger daily decline is within noise. The takeaway is a market trading as a single risk unit right now, with no idiosyncratic ETH or BTC catalyst driving separation.
Strategy Fit
Today's conditions — neutral RSI on both assets, volume at roughly half of recent averages, and price oscillating in tight ranges between well-defined support and resistance — are characteristic of a consolidation regime rather than a strong trend or a sharp selloff. In such environments, range-bound strategies tend to fit the tape better than directional ones, since there is no confirmed breakout or breakdown to follow. Grid trading, which places layered buy and sell orders around a set range, is structurally suited to this kind of low-volatility, mean-reverting price action. For traders with a longer horizon, dollar-cost averaging into established positions can also make sense during quiet pullbacks, while trend-following approaches typically need a volume-backed break of the MA cluster to offer a clear signal.
Pionex offers built-in bots that map to these regimes — grid bots for range conditions and DCA bots for gradual accumulation — allowing users to automate execution without building infrastructure. That said, strategy selection should always reflect personal risk tolerance, position sizing, and time horizon rather than today's tape alone.
Risk Disclaimer
This article is for informational purposes only and does not constitute financial, investment, or trading advice. Cryptocurrency markets are highly volatile and can result in the loss of all invested capital. The technical levels and observations discussed are based on historical data and do not guarantee future outcomes. Always conduct your own research and consult a licensed financial professional before making any investment decisions.
FAQ
What is Bitcoin's price on 2026-09-16?
BTC/USDT is trading at $75,558, down 0.11% over 24 hours, with a session high of $76,304 and low of $75,350.
How is Ethereum performing today?
ETH/USDT is at $2,390, down 0.35% over 24 hours, with a 24-hour range of $2,430 to $2,383.
What do the RSI readings indicate?
BTC's RSI(14) is 44.1 and ETH's is 49.8 — both in neutral territory, meaning neither asset is currently overbought or oversold.
Why is trading volume so low?
BTC volume is at 0.47x its 7-day average and ETH at 0.37x, indicating reduced participation during this consolidation phase.
What are the key levels to watch?
For BTC, support at $74,968 and resistance at $76,758. For ETH, support at $2,359 and resistance at $2,466.


