BTC ETH Daily Recap — 2026-09-20

BTC ETH Daily Recap — 2026-09-20
Today at a Glance
Bitcoin enters the weekend session at $80,580, down 0.82% over 24 hours but up a solid 4.86% on the week and 4.55% on the month. The daily range was tight — a high of $81,330 against a low of $80,126 — suggesting consolidation near the upper end of the recent recovery rather than fresh directional conviction. Volume tells the more interesting story: BTC traded at just 0.45x its 7-day average, a notable activity drop that often accompanies coiling price action after a multi-day advance.
Ethereum followed a similar script but with slightly softer intraday footing, printing $2,582 after a 1.92% decline. ETH remains the relative outperformer across both windows, up 4.24% on the week and 6.59% on the month. Its RSI(14) of 55.2 sits modestly above BTC's 50.8, and ETH volume came in even lighter at 0.37x the 7-day average. Both assets are holding above their short- and medium-term moving averages, keeping the broader structure constructive even as today's tape cools.
Bitcoin Analysis
TradingView Live (4h)
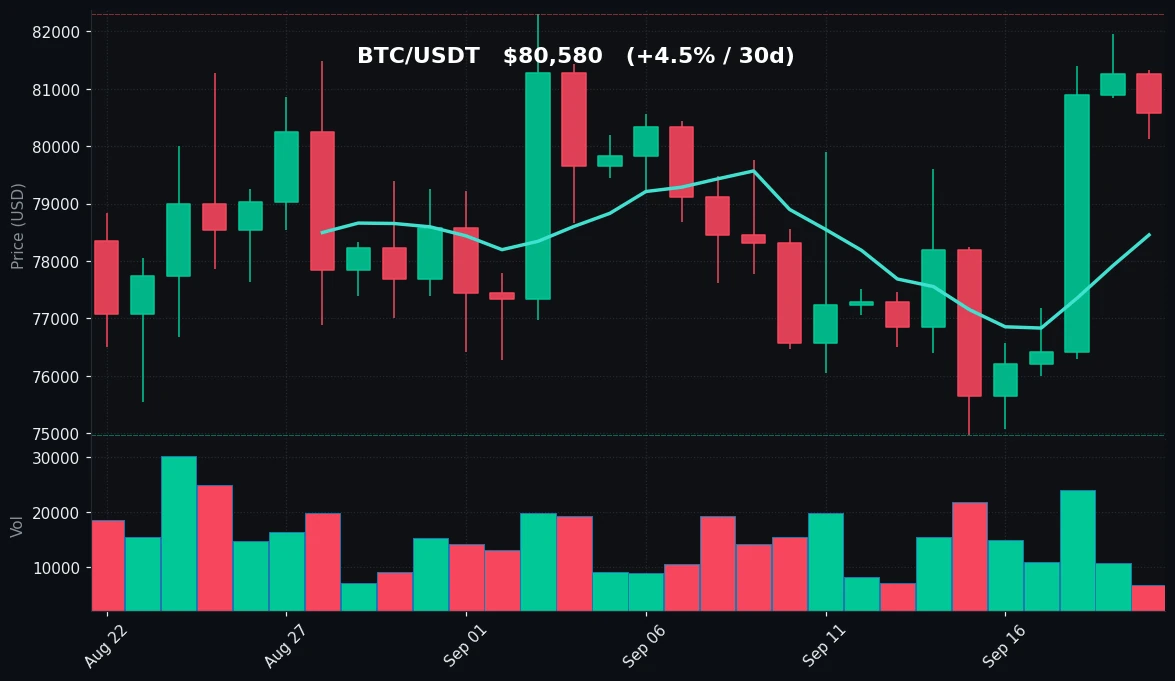
Bitcoin's daily structure remains constructive on a multi-timeframe basis despite today's modest pullback. The 7-day gain of 4.86% and 30-day gain of 4.55% place price at $80,580, comfortably above both the MA7 at $78,453 and the MA30 at $78,427. Notably, those two moving averages have converged within roughly $26 of each other — a compressed band that signals the short-term trend has caught up to the medium-term trend. When the MA7 sits marginally above the MA30, it reflects a market that has stabilized and is grinding rather than trending violently in either direction.
On the levels that matter: the 7-day high at $81,951 and the 30-day high at $82,300 form the immediate resistance ceiling. Price at $80,580 is trading roughly 1.7% below the 7-day high and about 2.1% below the 30-day peak, meaning BTC is consolidating in the upper quartile of its recent range rather than testing the highs. To the downside, the 7-day and 30-day lows both sit at $74,968 — an identical print that marks a clean, well-tested support shelf. Between current price and that floor, the MA7/MA30 cluster near $78,400-$78,450 is the first meaningful structural support. Today's low of $80,126 held well above that zone.
Momentum is balanced. RSI(14) at 50.8 is essentially neutral — the midpoint reading indicates neither overbought nor oversold conditions, and it suggests the recent rally has been digested without leaving the market extended. This is consistent with a market that has room to move in either direction without an immediate mean-reversion trigger.
The volume picture is the standout observation. BTC traded at 0.45x its 7-day average, less than half of typical activity. Low-volume consolidation after a 4.86% weekly advance can be interpreted two ways: as healthy digestion where holders refrain from selling, or as a lack of fresh demand to push through resistance. What the data supports without speculation is simply that participation has thinned. In such conditions, price is more susceptible to outsized moves on relatively small order flow, and the $81,951-$82,300 resistance band versus the $78,400 moving-average support define the near-term boundaries. The identical $74,968 low across both 7-day and 30-day windows remains the deeper structural reference point.
Ethereum Analysis
TradingView Live (4h)
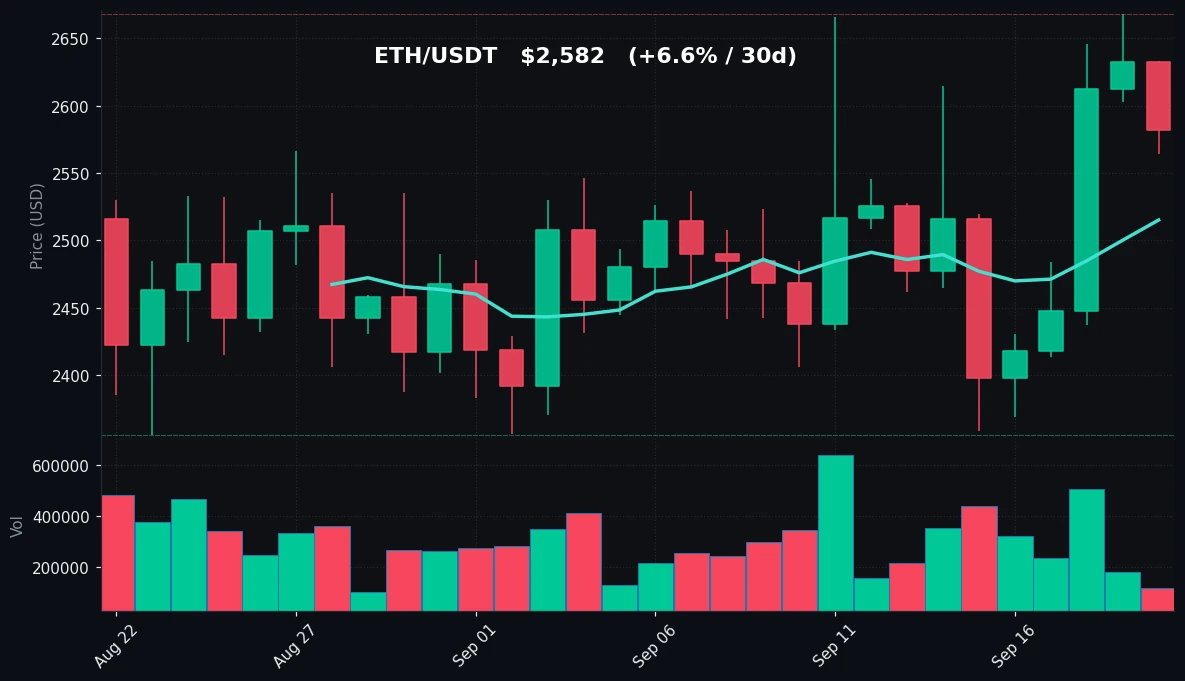
Ethereum is trading at $2,582, down 1.92% on the day but up 4.24% over seven days and 6.59% over thirty days — the stronger of the two majors on both trailing windows. The daily range saw a high of $2,633 and a low of $2,564, and current price sits near the lower portion of that band, roughly 1.9% below the day's high.
The technical backdrop is slightly more bullish than BTC's on the moving-average front. ETH's MA7 at $2,515 and MA30 at $2,480 are both well below spot price, with a $35 gap between them. Price trading about 2.7% above the MA7 and 4.1% above the MA30 indicates ETH has extended further above its trend baselines than Bitcoin has — a sign of relative strength, but also a reminder that the distance to support is wider.
Key levels are clearly defined. The 7-day high at $2,668 and the 30-day high at $2,668 are the same figure, confirming that ETH's recent peak is a single, well-established resistance point. Spot at $2,582 is about 3.2% below that ceiling. On the downside, the 7-day low at $2,359 and the 30-day low at $2,356 are within $3 of each other — effectively a double-tested support floor around $2,356-$2,359. Between price and that floor, the MA7 at $2,515 and MA30 at $2,480 provide layered support.
RSI(14) at 55.2 is in neutral-to-mildly-positive territory, above the 50 midpoint but far from overbought. This reading suggests ETH retains modest upward momentum without being stretched. The divergence from BTC's 50.8 is small but consistent with ETH's stronger trailing performance.
Volume is the caution flag. At 0.37x the 7-day average, ETH activity is even lighter than BTC's, marking one of the quieter sessions in the recent window. Thin volume during a consolidation phase near range highs means the market is not aggressively distributing, but it also lacks the participation to confirm a breakout. The combination of neutral-positive RSI, price above both moving averages, and a defined resistance at $2,668 gives ETH a constructive but unconfirmed posture. The $2,356-$2,359 double-bottom region remains the key structural line in the sand.
Key Technical Levels
| Asset | Support | Resistance | RSI |
|---|---|---|---|
| BTC | $78,400 (MA7/MA30 cluster); $74,968 (7d/30d low) | $81,951 (7d high); $82,300 (30d high) | neutral (50.8) |
| ETH | $2,515 (MA7); $2,480 (MA30); $2,356-$2,359 (7d/30d low) | $2,668 (7d/30d high) | neutral (55.2) |
BTC vs ETH Dynamic
BTC and ETH are moving in the same direction with broadly similar magnitude, but the correlation is not one-to-one today. Both printed negative 24-hour sessions (BTC -0.82%, ETH -1.92%), yet ETH's decline was more than double BTC's, and ETH's trailing 7-day and 30-day gains exceed BTC's by a modest margin. This pattern — ETH outperforming on the way up and underperforming on a soft day — is typical of a higher-beta asset within a correlated pair. The shared structural features reinforce the linkage: both assets sit above their MA7 and MA30, both have RSI readings clustered near the 50-55 neutral zone, and both recorded identical or near-identical lows across the 7-day and 30-day windows (BTC at $74,968; ETH at $2,356-$2,359), indicating the same macro swing defined both ranges. The primary divergence is volume: BTC at 0.45x and ETH at 0.37x of their 7-day averages show that capital flow has slowed across the board, not rotated between the two.
Strategy Fit
Today's conditions — neutral RSI on both majors, price consolidating in the upper portion of the range, and volume running at roughly 0.37x-0.45x of recent averages — describe a low-volatility, range-bound environment rather than a trending one. In such regimes, mean-reversion and accumulation approaches tend to fit the tape better than momentum-chasing strategies.
Grid strategies are conceptually suited to this setup because price is oscillating between defined boundaries: for BTC, roughly $78,400 support to $82,300 resistance, and for ETH, roughly $2,480-$2,515 support to $2,668 resistance. A grid can systematically buy into weakness and sell into strength within those bands without requiring a directional call. Dollar-cost averaging (DCA) is another reasonable fit for participants with a longer horizon, given that both assets hold above their medium-term moving averages and RSI is not extended. Trend-following strategies are less aligned with today's data, since the low volume and neutral momentum offer no confirmation of a directional breakout.
Pionex offers built-in bots designed for exactly these conditions — including Grid Trading bots and DCA bots — which can automate range-bound execution without manual order management. Matching a bot type to the prevailing volatility regime is the practical takeaway: range conditions favor grid and DCA frameworks, while sustained breakout volume would be the signal that a trend-oriented approach deserves reconsideration.
Risk Disclaimer
This article is for informational purposes only and does not constitute financial, investment, or trading advice. Cryptocurrency markets are highly volatile and can result in the total loss of capital. The technical levels, indicators, and strategy observations discussed above are based on historical price data and do not predict future outcomes. Always conduct your own research and consult a qualified financial professional before making any investment decisions. Past performance is not indicative of future results.
FAQ
What price did Bitcoin trade at on 2026-09-20?
BTC/USDT was at $80,580, down 0.82% over 24 hours, with a daily high of $81,330 and a low of $80,126.
How did Ethereum perform on the same day?
ETH/USDT traded at $2,582, down 1.92% on the day, within a 24-hour range of $2,633 high to $2,564 low.
What do the RSI readings indicate for BTC and ETH?
BTC's RSI(14) is 50.8 and ETH's is 55.2, both in neutral territory — neither overbought nor oversold.
What are the key support and resistance levels right now?
BTC support sits near the MA7/MA30 cluster around $78,400 with a deeper floor at $74,968, and resistance at $81,951-$82,300. ETH support is at $2,515/$2,480 with a floor at $2,356-$2,359, and resistance at $2,668.
Why is low trading volume significant today?
BTC volume is 0.45x and ETH volume is 0.37x their respective 7-day averages, indicating thin participation during consolidation — a condition that can amplify price moves on relatively small order flow.


