BTC ETH Daily Recap — 2026-09-21

BTC ETH Daily Recap — 2026-09-21
Today at a Glance
Bitcoin and Ethereum both closed a strong session on 2026-09-21, with BTC trading at $85,323 after a +5.11% move over 24 hours and ETH at $2,727, up +3.08% over the same window. Bitcoin's daily range was wide, spanning a low of $80,850 to a high of $85,845, meaning the session's peak now also stands as the 7-day and 30-day high. Ethereum's range was comparatively tighter, from $2,644 to $2,750, with that $2,750 print likewise marking both its 7-day and 30-day high. On a weekly basis, BTC is +9.12% and ETH +8.39%; over 30 days, BTC is +9.76% and ETH +10.69%. Both assets are trading above their 7-day and 30-day moving averages. RSI(14) readings sit at 67.8 for BTC and 67.6 for ETH — elevated, but below the classic 70 overbought threshold. BTC volume ran 1.33x its 7-day average, while ETH volume was roughly in line at 1.08x.
Bitcoin Analysis
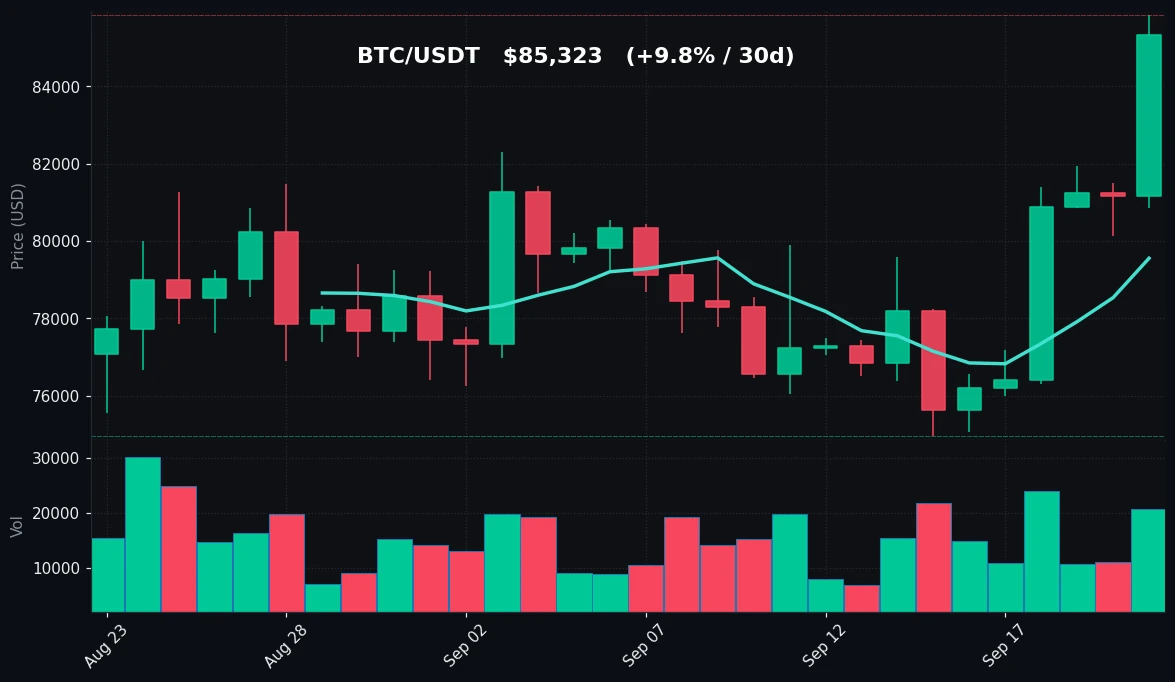
TradingView Live (4h)
Bitcoin enters this recap at $85,323, having advanced +5.11% in 24 hours and +9.12% over seven days. The structure of the move is notable for its breadth: the 24-hour low of $80,850 and high of $85,845 span nearly $5,000, and the high coincides exactly with both the 7-day and 30-day highs at $85,845. That convergence means BTC is trading at the upper boundary of its recent range rather than in the middle of it — a positioning detail that matters more than the headline percentage gain.
On the moving-average front, the picture is constructive. The MA7 sits at $79,558 and the MA30 at $78,721, both meaningfully below the current price of $85,323. The gap between price and the MA7 (roughly $5,765, or about 7.2% above it) indicates that the latest leg higher has been sharp relative to the trailing week's average. The MA7 also sits slightly above the MA30, a configuration consistent with a short-term uptrend that has been building through the month. The 30-day low of $74,968 provides a useful reference for how far the market has traveled: from that level to the current price is a move of approximately 13.8%.
Volume adds context. BTC traded at 1.33x its 7-day average volume, which means the advance was accompanied by above-average participation rather than a thin, drift-higher move. In range-expansion phases, volume confirmation is one of the more reliable tells that a breakout attempt has genuine backing; here, the combination of a new 7-day/30-day high and 1.33x volume is internally consistent with a market that is being actively repriced.
Momentum, however, is where caution enters. RSI(14) at 67.8 is in the upper portion of the neutral band and approaching — but not crossing — the 70 line conventionally associated with overbought conditions. In strong trends, RSI can hold in the 60s for extended periods, so this reading is not, by itself, a reversal signal. It does, however, indicate that the easy part of the move from the $74,968 low has already been captured, and that the margin for further upside without a consolidation is narrowing.
Key technical reference points for BTC are therefore: support around the $80,850 session low, with the MA7 at $79,558 as a secondary dynamic support and the MA30 at $78,721 below that. Resistance is the $85,845 high, which is now a triple reference (24h, 7d, 30d). A sustained hold above that level would represent range expansion; failure to clear it keeps BTC in a well-defined upper-range position. No directional prediction is implied — the data simply defines the boundaries.
Ethereum Analysis
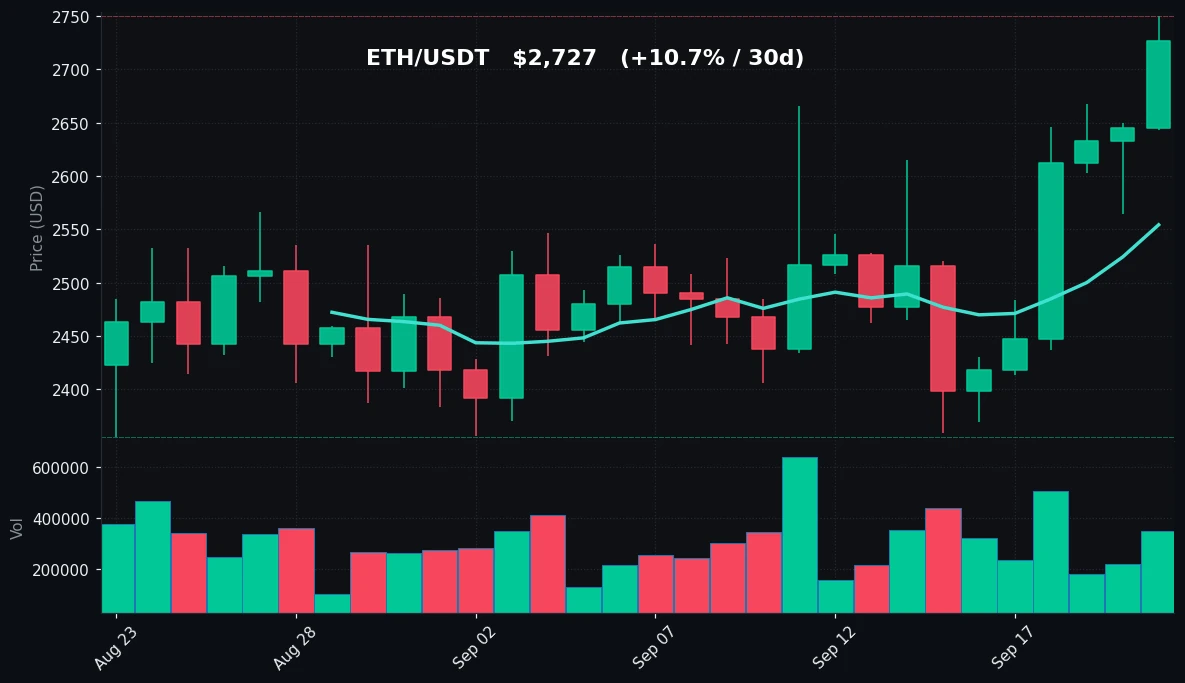
TradingView Live (4h)
Ethereum trades at $2,727, up +3.08% on the day, +8.39% on the week, and +10.69% over 30 days. The 24-hour range ran from $2,644 to $2,750, and as with BTC, the session high doubles as the 7-day and 30-day high at $2,750. ETH's 30-day low of $2,356 and 7-day low of $2,359 are nearly identical, suggesting the base of this move formed roughly a month ago and has not been revisited since.
The moving-average structure mirrors Bitcoin's. MA7 stands at $2,554 and MA30 at $2,492, both below the current price of $2,727. The distance from price to MA7 is about $173, or roughly 6.8% — slightly less extended than BTC's 7.2% gap, but comparable in character. The MA7 above MA30 alignment again points to a short-term uptrend intact through the period. Measured from the 30-day low of $2,356, ETH has gained approximately 15.7%, outpacing BTC's 13.8% advance from its own 30-day low — a detail worth noting in the relative-performance discussion below.
Volume behavior differs from BTC. ETH traded at 1.08x its 7-day average, essentially flat. Where BTC's advance came on 1.33x volume, ETH's came on roughly average participation. That does not invalidate the move, but it does mean the breakout to $2,750 has less volume confirmation behind it than BTC's equivalent push. Traders watching for follow-through would typically want to see volume expand on any continuation above the high.
RSI(14) for ETH is 67.6, marginally below BTC's 67.8 and in the same upper-neutral zone. Both assets are knocking on the door of overbought territory without entering it. For ETH specifically, the RSI reading combined with flat volume suggests momentum is positive but not accelerating — a profile more consistent with a steady grind than a parabolic extension.
Technical reference points for ETH: support at the $2,644 session low, with the MA7 at $2,554 as the first dynamic level and MA30 at $2,492 beneath it. Resistance is the $2,750 high, which — like BTC's $85,845 — now serves as the 24-hour, 7-day, and 30-day ceiling. The $2,750 level is the pivot to watch for any range-expansion scenario. Again, no forecast is offered; these are the levels the data defines.
Key Technical Levels
| Asset | Support | Resistance | RSI |
|---|---|---|---|
| BTC | $80,850 (24h low) / $79,558 (MA7) / $78,721 (MA30) | $85,845 (24h, 7d & 30d high) | 67.8 — neutral, approaching overbought |
| ETH | $2,644 (24h low) / $2,554 (MA7) / $2,492 (MA30) | $2,750 (24h, 7d & 30d high) | 67.6 — neutral, approaching overbought |
BTC vs ETH Dynamic
BTC and ETH moved in the same direction on 2026-09-21, with BTC +5.11% and ETH +3.08% over 24 hours — a clear positive correlation in direction, though BTC led on the day. Over longer windows the relationship is closer: 7-day returns of +9.12% (BTC) versus +8.39% (ETH), and 30-day returns of +9.76% versus +10.69%. That 30-day figure is the interesting one, because it shows ETH slightly ahead of BTC over the month even as BTC outperformed on the day and week. Both assets printed their 24-hour high at their respective 7-day and 30-day highs, meaning they are moving in structural lockstep at the top of their ranges. The divergence is in participation: BTC's 1.33x volume versus ETH's 1.08x suggests capital flowed more decisively into Bitcoin during this leg. The RSI readings are nearly identical (67.8 vs 67.6), reinforcing that the two are in the same phase of their respective cycles, with ETH's marginally stronger 30-day return hinting at a modest catch-up dynamic rather than independent strength.
Strategy Fit
Today's data describes two assets in confirmed short-term uptrends (price above both MA7 and MA30), trading at the top of their 7-day and 30-day ranges, with RSI in the high 60s and volume above average for BTC but flat for ETH. That combination — trend intact but momentum nearing overbought — tends to favor strategies that can participate in continued upside while managing the risk of a pullback toward the moving averages.
For range-aware traders, the well-defined boundaries are notable: BTC's $80,850–$85,845 and ETH's $2,644–$2,750 give grid strategies clear edges to work with, particularly if price consolidates below the highs rather than breaking out immediately. Grid bots, such as those built into Pionex, are designed for exactly this kind of bounded oscillation and can automate buy-low/sell-high execution within a chosen band. For those with a longer horizon and no desire to time entries, DCA bots — also available natively on Pionex — offer a systematic way to accumulate through volatility rather than reacting to single sessions. Trend-following approaches would key off a sustained break above $85,845 (BTC) or $2,750 (ETH) for continuation signals, or a loss of the MA7 for a trend-weakening read. The choice depends on risk tolerance and time horizon; the data supports all three frameworks depending on the assumption being expressed.
Risk Disclaimer
This market recap is provided for informational purposes only and does not constitute financial, investment, or trading advice. Nothing here should be interpreted as a recommendation to buy, sell, or hold any asset. Cryptocurrency markets are highly volatile and can result in the total loss of capital. Technical indicators such as RSI, moving averages, and volume ratios describe past behavior and do not guarantee future results. Always conduct your own research and consult a qualified financial professional before making any investment decision.
FAQ
What was Bitcoin's price on 2026-09-21?
BTC/USDT traded at $85,323, up +5.11% over 24 hours, with a session range of $80,850 to $85,845.
What was Ethereum's price on 2026-09-21?
ETH/USDT traded at $2,727, up +3.08% over 24 hours, with a session range of $2,644 to $2,750.
Are BTC and ETH overbought right now?
Neither is technically overbought by the standard RSI(14) > 70 threshold. BTC's RSI is 67.8 and ETH's is 67.6 — both in the upper-neutral zone, approaching but not crossing the overbought line.
What are the key resistance levels to watch?
BTC's resistance is $85,845, which is simultaneously its 24-hour, 7-day, and 30-day high. ETH's is $2,750, which holds the same triple significance.
Which strategy suits the current market condition?
With both assets above their MA7 and MA30 and trading at range highs, grid strategies suit bounded conditions, DCA suits long-horizon accumulation, and trend strategies key off breaks above the stated resistance levels. Pionex offers built-in bots for all three approaches. This is not financial advice.


