BTC ETH Daily Recap — 2026-09-22

BTC ETH Daily Recap — 2026-09-22
Today at a Glance
Bitcoin and Ethereum both paused on Tuesday following an explosive weekly advance, with BTC slipping 0.51% over 24 hours to $86,174 and ETH easing 0.83% to $2,753. The pullback is modest in context: both assets remain deep in weekly gains, with BTC up 13.92% and ETH up 14.80% over seven days. Intraday ranges were compressed, with BTC confined between $85,114 and $86,626 and ETH between $2,716 and $2,778. Notably, BTC printed a fresh 30-day high of $87,396 within the past week and is now consolidating just below that ceiling, while ETH matched its own 30-day peak at $2,807. Volume tells the more interesting story: BTC traded at 0.69x its 7-day average and ETH at just 0.47x, signaling that the rally's fuel is fading into this pause. RSI readings are elevated — 70.9 for BTC and 68.1 for ETH — placing both near overbought territory.
Bitcoin Analysis
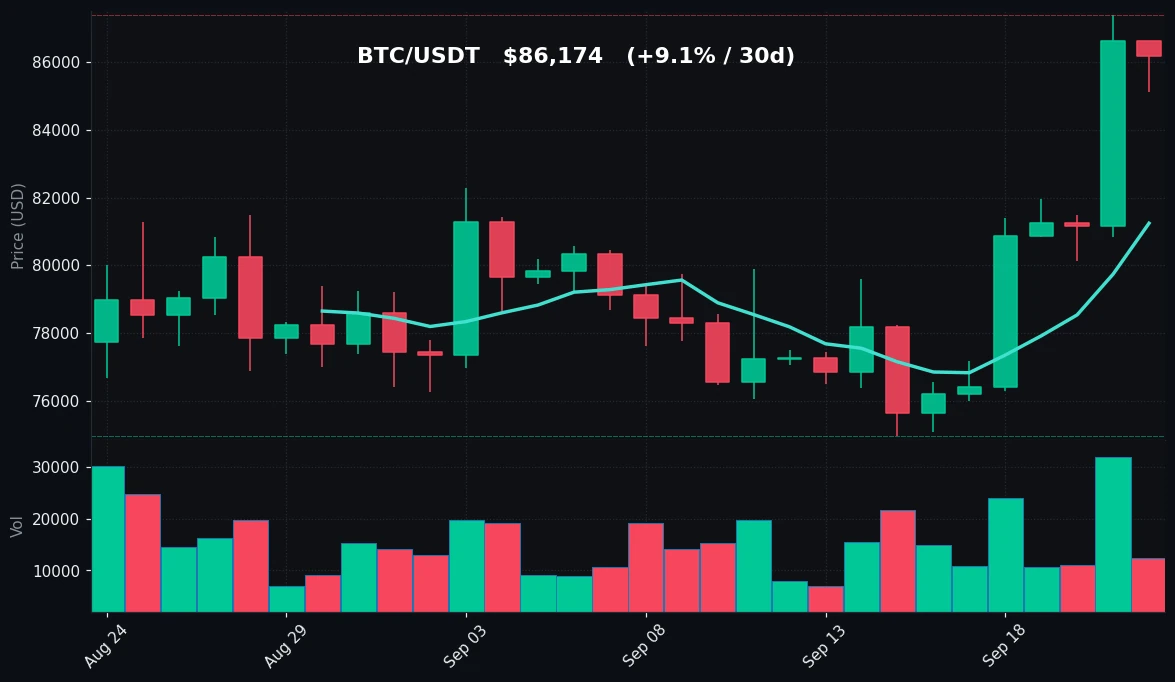
TradingView Live (4h)
Bitcoin's structure remains decisively bullish on higher timeframes despite today's mild red candle. The asset has climbed from a 7-day low of $75,065 to a 30-day high of $87,396, a roughly 16% range expansion that has lifted price well clear of both its 7-day moving average at $81,247 and its 30-day moving average at $79,046. The gap between spot price and the MA7 — approximately $4,900, or nearly 6% — is unusually wide and reflects the velocity of the recent move rather than a gradual trend. Price is now consolidating in the upper portion of that range, holding above $85,000 on the intraday low and pressing toward the $87,396 ceiling that marks the 30-day high.
From a technical perspective, the key overhead reference is the $87,396 level, which represents both the 7-day and 30-day high. A sustained break above it would confirm continuation of the uptrend, while failure to reclaim it keeps the market in a consolidation band. On the downside, the first meaningful support sits near the $85,114 intraday low, followed by a wider air pocket down toward the MA7 at $81,247. That moving average is the more structurally significant line: it has acted as dynamic support during the advance, and its slope remains positive, consistent with the broader uptrend.
Momentum is the caution flag. RSI(14) at 70.9 is just above the traditional 70 overbought threshold, and it has been elevated long enough to suggest the move is extended. Importantly, this RSI reading comes on declining participation — volume at 0.69x the 7-day average means the push to new highs was not accompanied by expanding turnover. In technical analysis, price advancing on contracting volume is typically read as a sign of waning conviction rather than accumulation. That does not invalidate the trend, but it does mean the market is more vulnerable to mean-reversion toward the moving averages if sellers step in.
The daily range itself was narrow — just $1,512 between high and low — which, combined with the small percentage change, points to a digestion day after the weekly surge. There is no evidence of distribution or a trend break in the data; rather, this looks like a market catching its breath near the top of its range with momentum stretched and volume light. The neutral read: trend intact, momentum extended, participation thin.
Ethereum Analysis
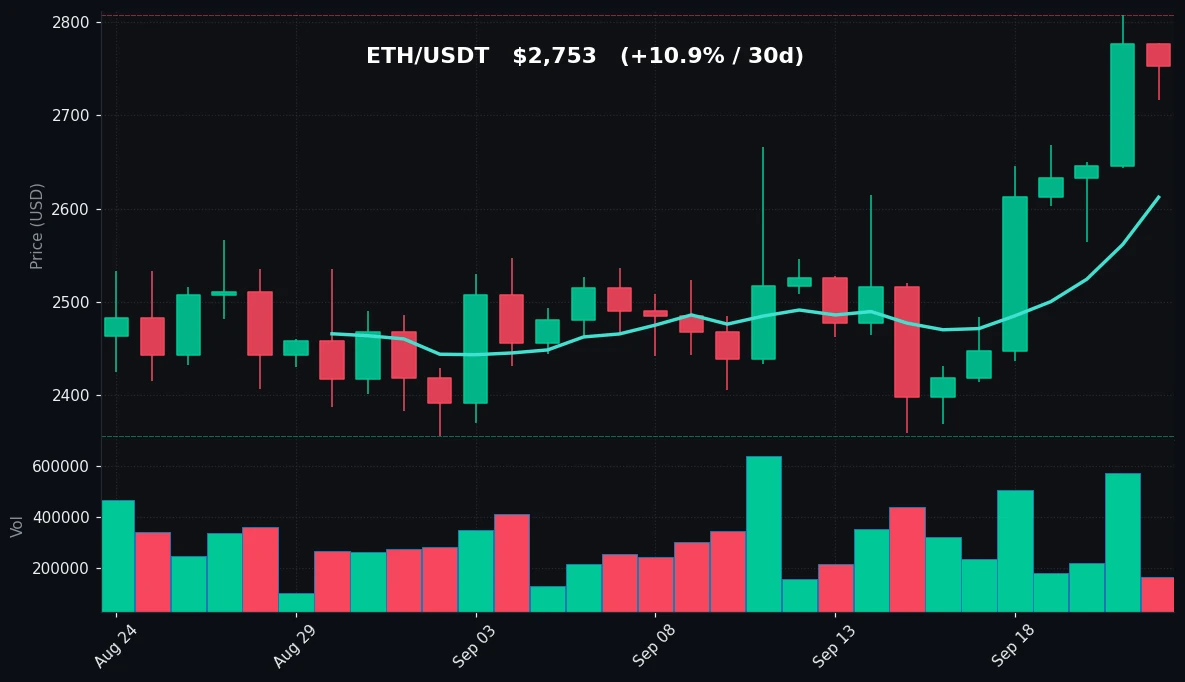
TradingView Live (4h)
Ethereum's daily picture closely mirrors Bitcoin's, with ETH trading at $2,753 after a 0.83% decline, having rallied 14.80% over seven days and 10.91% over thirty. The asset's 7-day low of $2,369 and 30-day low of $2,356 form a tight base from which price has advanced to a 30-day high of $2,807 — a move of roughly 19% from the monthly floor. Like BTC, ETH is consolidating just beneath its recent peak, with the intraday range contained between $2,716 and $2,778.
The moving average structure is constructive. ETH trades well above its MA7 at $2,612 and its MA30 at $2,503, with the shorter average above the longer one — a classic bullish alignment. The distance from spot to the MA7 is about $141, or roughly 5%, a similar extension to Bitcoin's. The first support zone to watch is the $2,716 intraday low, with the more consequential support at the MA7 near $2,612. The $2,807 level stands as the immediate resistance and the 30-day high; a close above it would mark a fresh breakout, while repeated rejection keeps ETH range-bound beneath it.
What stands out most in the Ethereum data is volume. At 0.47x the 7-day average, ETH is trading at less than half its recent typical turnover — a more pronounced contraction than Bitcoin's 0.69x. This is a significant divergence. During the weekly rally, ETH outperformed BTC on a percentage basis (+14.80% vs +13.92%), yet today's consolidation is happening on notably thinner participation. Thin volume during a pause can be benign — simply a lack of sellers — but it also means the market lacks the depth to absorb a larger sell order without a sharp move.
RSI(14) at 68.1 sits just below the overbought line, slightly cooler than Bitcoin's 70.9. That marginally lower reading suggests ETH has a touch more room before momentum becomes technically stretched, though the difference is minor. The overall read is the same as BTC's: an intact uptrend, extended momentum, and a market digesting gains on light volume. ETH's relative outperformance over the week, combined with its lower RSI and thinner volume, paints a picture of an asset that ran hard and is now drifting quietly near its highs.
Key Technical Levels
| Asset | Support | Resistance | RSI |
|---|---|---|---|
| BTC | $85,114 (intraday low) / $81,247 (MA7) | $87,396 (30d high) | 70.9 — overbought |
| ETH | $2,716 (intraday low) / $2,612 (MA7) | $2,807 (30d high) | 68.1 — neutral, near overbought |
BTC vs ETH Dynamic
BTC and ETH are moving in near lockstep, with both posting similar daily declines (-0.51% vs -0.83%) and comparable weekly gains (+13.92% vs +14.80%), confirming the high positive correlation that has defined this cycle. The subtle divergence lies in participation: ETH's volume contraction (0.47x) is deeper than BTC's (0.69x), and its RSI is marginally cooler. This suggests ETH led the rally on a relative basis but is now consolidating with less liquidity support, while BTC retains slightly firmer turnover. Neither asset is showing independent strength or weakness — the pair remains a single risk-on trade, and the correlation is likely to hold until a catalyst forces differentiation.
Strategy Fit
With both assets in strong uptrends but extended above their moving averages, momentum stretched, and volume contracting, today's conditions favor defined, rules-based approaches over discretionary directional bets. The wide gap between spot and the MA7 creates a natural range for grid strategies, which profit from oscillation within a band — a fitting setup when price is consolidating near highs rather than trending cleanly. For investors with a longer horizon, DCA remains a reasonable way to manage entry risk given the overbought RSI readings, smoothing exposure rather than chasing the top of the range. Trend-following approaches remain valid while price holds above the MA7 and MA30, but the thin volume argues for tighter risk controls. Pionex offers built-in bots tailored to these conditions — grid trading bots for range-bound consolidation, DCA bots for gradual accumulation, and trend-following bots for continuation setups — allowing users to automate execution without needing to predict direction.
Risk Disclaimer
This content is for informational purposes only and does not constitute financial, investment, or trading advice. Cryptocurrency markets are highly volatile and carry substantial risk of loss. The data and technical observations above reflect past and current market conditions only and are not predictive of future results. Always conduct your own research and consult a qualified professional before making any investment decisions.
FAQ
What was Bitcoin's price on 2026-09-22?
BTC traded at $86,174, down 0.51% over 24 hours, with an intraday range of $85,114 to $86,626.
How did Ethereum perform today?
ETH stood at $2,753, down 0.83% in 24 hours, within a range of $2,716 to $2,778. It remains up 14.80% over seven days.
Are BTC and ETH overbought right now?
BTC's RSI(14) is 70.9, just above the overbought threshold. ETH's is 68.1, slightly below it but still elevated.
What are the key levels to watch?
For BTC, resistance is $87,396 and support is $85,114, with the MA7 at $81,247. For ETH, resistance is $2,807 and support is $2,716, with the MA7 at $2,612.
Why is volume important in today's recap?
BTC volume is 0.69x its 7-day average and ETH is 0.47x, indicating the recent rally is consolidating on thin participation, which can signal waning momentum.


