BTC ETH Daily Recap — 2026-09-23

BTC ETH Daily Recap — 2026-09-23
Today at a Glance
Bitcoin is trading at $85,788, down 0.49% over the past 24 hours, while Ethereum sits at $2,718, down 1.28% on the same timeframe. Both assets are consolidating just beneath local highs after a strong multi-day advance: BTC is up 12.57% over seven days and 9.23% over 30 days, and ETH has gained 12.41% and 11.29% over the same windows. Today's intraday ranges were relatively contained — BTC oscillated between $85,267 and $87,279, and ETH between $2,708 and $2,789 — suggesting a pause rather than a reversal. Notably, volume is running well below recent norms, at 0.58x the 7-day average for BTC and 0.50x for ETH. RSI(14) reads 70.0 for Bitcoin and 66.5 for Ethereum, placing BTC right at the overbought threshold and ETH in upper-neutral territory. Both assets remain comfortably above their 7-day and 30-day moving averages.
Bitcoin Analysis
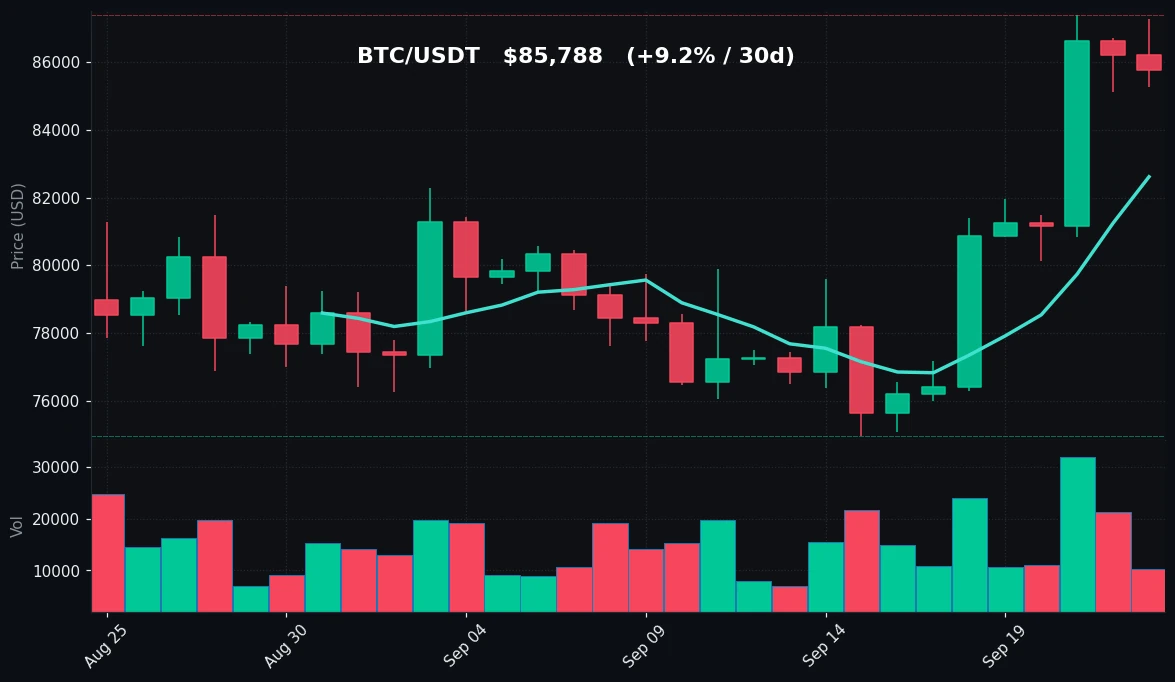
TradingView Live (4h)
Bitcoin's daily structure remains constructive. Price at $85,788 is holding well above both the MA7 at $82,621 and the MA30 at $79,274, and the ordering of those averages — shorter above longer — reflects a sustained uptrend that has been building through September. The 7-day range tells the story of the move: a low of $76,000 against a high of $87,396, meaning BTC has covered roughly $11,400 of ground in a week. The 30-day range is even wider, with a low of $74,968, so the current price sits near the upper boundary of the monthly range rather than in the middle of it.
On the immediate timeframe, today's action is a modest pullback. The 24-hour high of $87,279 fell just short of the 7-day and 30-day high at $87,396 — a level that has now capped price twice, making it the clearest near-term resistance. The 24-hour low of $85,267 is the first line of intraday support, with the MA7 at $82,621 forming a deeper structural floor beneath it. Between those two zones, price is essentially digesting the prior advance.
Momentum is the key nuance. RSI(14) at 70.0 sits exactly at the conventional overbought line. That reading does not by itself signal exhaustion — in strong trends, RSI can hold at or above 70 for extended periods — but it does mean the move is no longer early. Combined with volume at just 0.58x the 7-day average, today's drift lower looks more like low-conviction profit-taking than aggressive distribution. Thin volume on a pullback within an uptrend is generally a less bearish signal than heavy volume on a decline, though it also means there is little fresh demand pushing price through the $87,396 ceiling right now.
The technical picture, then, is a market that has run hard, is resting just below a well-defined resistance, and is doing so on declining participation. The trend structure (price > MA7 > MA30) is intact, support levels are clearly defined, and momentum is elevated but not extreme. No directional call is warranted from these readings alone — the data simply describes a strong uptrend in a consolidation phase beneath resistance.
Ethereum Analysis
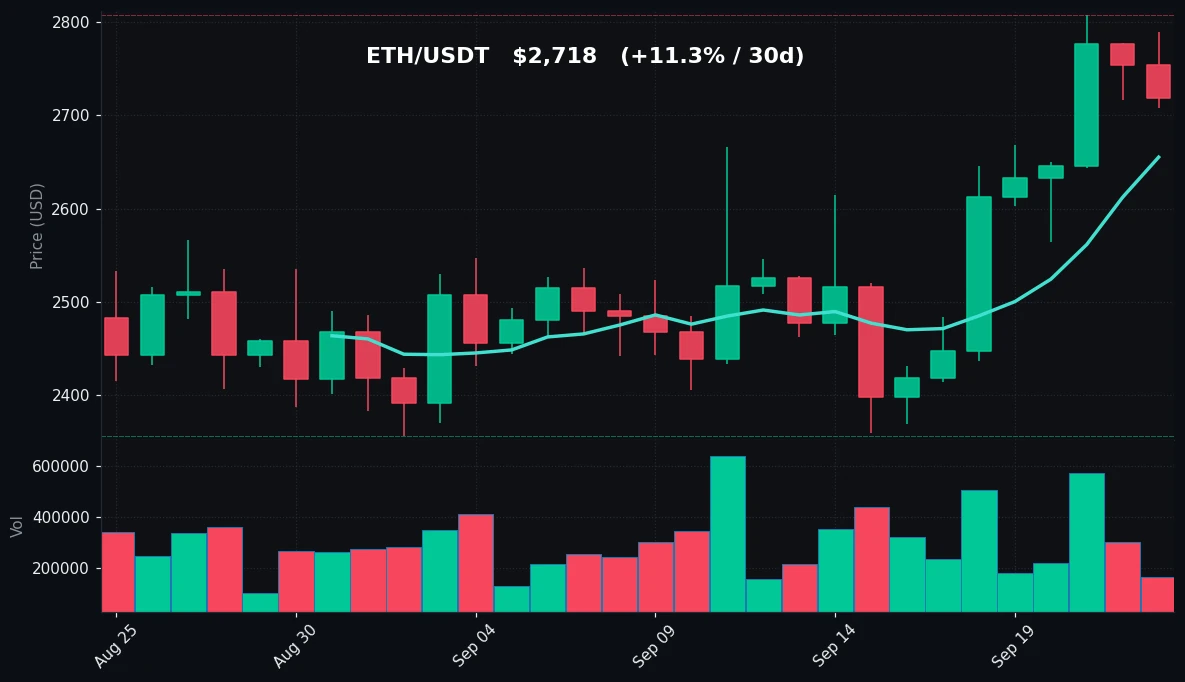
TradingView Live (4h)
Ethereum's setup broadly mirrors Bitcoin's, with a few distinctions worth noting. ETH trades at $2,718, above its MA7 of $2,655 and MA30 of $2,511, so the same bullish moving-average stack is in place. The 7-day range runs from $2,414 to $2,807, and the 30-day range from $2,356 to $2,807 — meaning the 7-day high and 30-day high are identical at $2,807, a level that represents the monthly peak and the primary resistance overhead.
Today's session saw ETH decline 1.28%, a slightly sharper drop than BTC's 0.49%. The 24-hour range of $2,708 to $2,789 shows price pressing toward the lower end of that band by the close, and the 24-hour low at $2,708 is only about $10 above the current price — a tighter cushion than BTC has above its own intraday low. The first meaningful support below is the MA7 at $2,655, followed by the MA30 at $2,511.
RSI(14) for ETH reads 66.5, below Bitcoin's 70.0 and below the overbought threshold. This is consistent with ETH having cooled slightly more during today's session. It also means Ethereum has marginally more headroom on momentum indicators before reaching the same stretched condition Bitcoin is showing.
Volume is the notable feature: ETH traded at just 0.50x its 7-day average, the lightest participation in this comparison. As with BTC, low volume accompanying a modest decline suggests limited selling pressure rather than a decisive shift in positioning. The 7-day gain of 12.41% and 30-day gain of 11.29% confirm ETH has participated fully in the broader advance, and its position above both moving averages keeps the trend structure positive. The immediate question the data poses is whether $2,807 continues to cap upside and whether $2,655 (MA7) holds if the current drift extends.
Key Technical Levels
| Asset | Support | Resistance | RSI |
|---|---|---|---|
| BTC | $85,267 (24h low) / $82,621 (MA7) / $79,274 (MA30) | $87,396 (7d & 30d high) / $87,279 (24h high) | 70.0 — overbought threshold |
| ETH | $2,708 (24h low) / $2,655 (MA7) / $2,511 (MA30) | $2,807 (7d & 30d high) / $2,789 (24h high) | 66.5 — upper neutral |
BTC vs ETH Dynamic
BTC and ETH are moving in close lockstep, with nearly identical 7-day performance (+12.57% vs +12.41%) and 30-day performance (+9.23% vs +11.29%), which points to a high correlation regime driven by broad market flow rather than asset-specific narratives. The small divergences are informative at the margin: ETH has slightly outperformed over 30 days, while BTC is showing the higher RSI (70.0 vs 66.5) and the shallower 24-hour drawdown (-0.49% vs -1.28%). Both are consolidating beneath resistance levels that coincide with their monthly highs — $87,396 for BTC and $2,807 for ETH — and both are doing so on subdued volume (0.58x and 0.50x respectively). In practical terms, the pair is currently trading as a single risk unit: the same macro impulse lifting one is lifting the other, and the same pause beneath resistance is affecting both.
Strategy Fit
Today's data describes a market in a consolidation phase within an established uptrend: price above both moving averages, RSI elevated (BTC at the overbought line, ETH just below), and volume running at roughly half of recent averages. That combination — range-bound short-term behavior inside a longer upward structure — is a context where grid trading strategies are commonly considered, since grids seek to capture oscillation between defined support and resistance zones such as BTC's $85,267–$87,396 band or ETH's $2,708–$2,807 band. DCA (dollar-cost averaging) approaches are also frequently discussed in trending markets where participants prefer staged exposure over single entries, particularly when momentum is stretched and timing is uncertain. Trend-following strategies, meanwhile, depend on sustained directional movement; with both assets pausing beneath resistance on light volume, the current session offers less for trend systems than the preceding week did. Pionex offers built-in bots — including grid trading and DCA bots — that can be configured to these kinds of market conditions directly on the platform. The appropriate choice depends entirely on individual objectives, risk tolerance, and market view; none of the above constitutes a recommendation.
Risk Disclaimer
This article is for informational purposes only and does not constitute financial, investment, or trading advice. Cryptocurrency markets are highly volatile and can result in the loss of all invested capital. Technical indicators, price levels, and historical data described above do not predict future performance. Always conduct your own research and consult a qualified financial professional before making any investment decision. You are solely responsible for your own trading activity.
FAQ
What price is Bitcoin trading at on 2026-09-23?
BTC/USDT is at $85,788, down 0.49% over 24 hours, with a daily range of $85,267 to $87,279.
What price is Ethereum trading at on 2026-09-23?
ETH/USDT is at $2,718, down 1.28% over 24 hours, with a daily range of $2,708 to $2,789.
Is Bitcoin overbought right now?
BTC's RSI(14) is 70.0, which sits exactly at the conventional overbought threshold. ETH's RSI is 66.5, below that line.
What are the key resistance levels for BTC and ETH?
BTC's primary resistance is $87,396, its 7-day and 30-day high. ETH's primary resistance is $2,807, also its 7-day and 30-day high.
How does today's volume compare to recent averages?
Volume is below recent norms for both assets: BTC is at 0.58x its 7-day average and ETH is at 0.50x, indicating lighter participation during today's consolidation.


