BTC ETH Daily Recap — 2026-09-17

BTC ETH Daily Recap — 2026-09-17
Today at a Glance
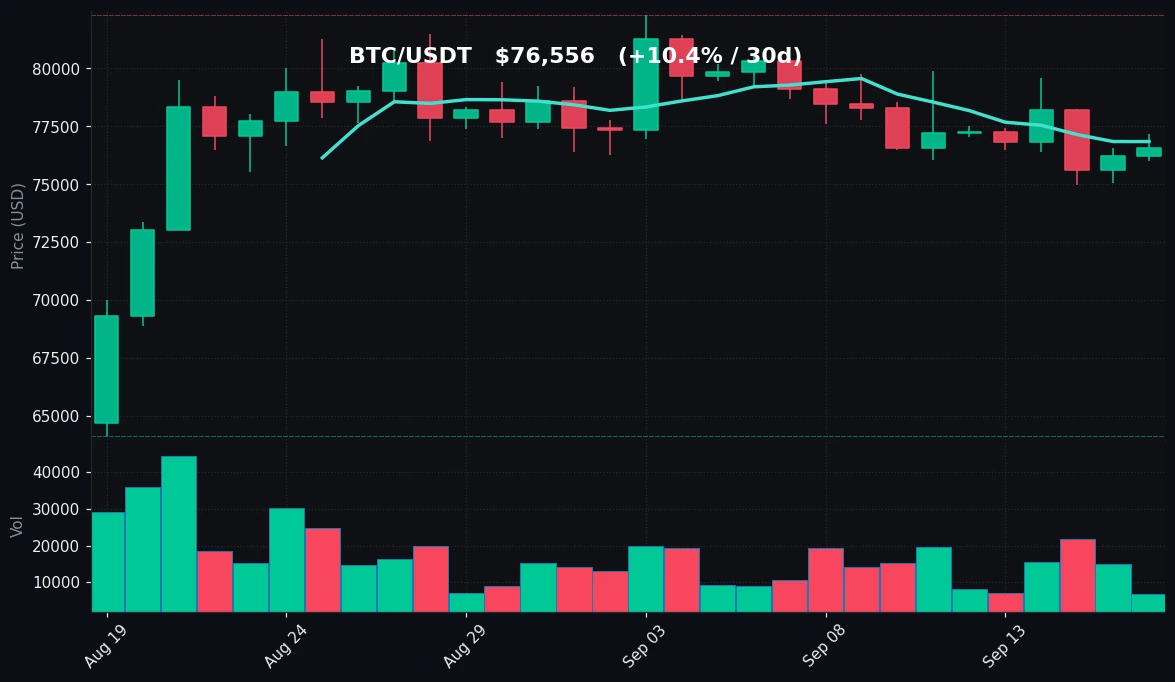
Bitcoin is trading at $76,556, up 0.46% over the past 24 hours, having carved out a narrow range between $76,000 and $77,179. The move does little to change the broader picture: BTC is essentially flat over seven days (-0.02%) while still holding a solid +10.41% gain across 30 days. Price continues to sit below both its 7-day ($76,849) and 30-day ($77,697) moving averages, and the 14-day RSI has slipped to 30.4 — the lowest reading in this dataset and one that places momentum firmly in oversold territory. Volume is running at just 0.46x the 7-day average, signaling thin participation.
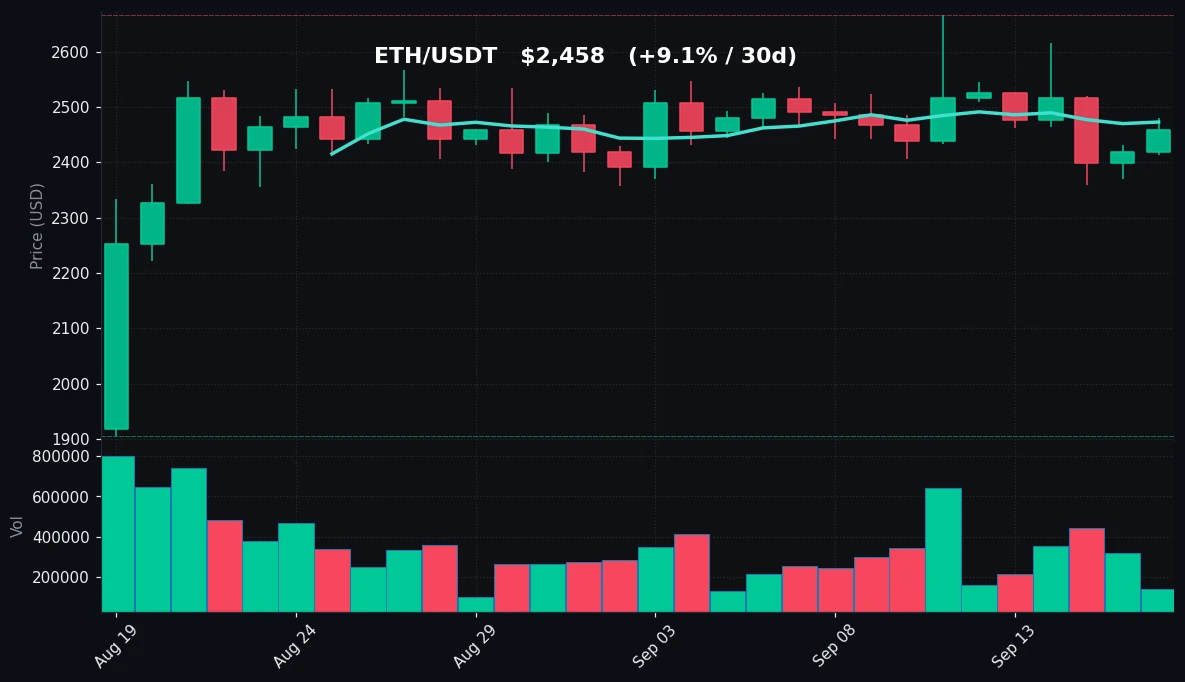
Ethereum is the relative outperformer today, up 1.65% to $2,458 on a 24-hour range of $2,414–$2,480. ETH is +0.82% on the week and +9.12% on the month, trading marginally above its 30-day MA ($2,456) but just below its 7-day MA ($2,473). RSI sits at a neutral 45.4, with volume at 0.40x the 7-day average.
Bitcoin Analysis
TradingView Live (4h)
Bitcoin's daily structure remains defined by compression rather than conviction. The past week has produced a range of roughly $4,900 — from a 7-day low of $74,968 to a 7-day high of $79,890 — yet the net seven-day change is a rounding error at -0.02%. That combination of wide intraweek swings and a flat weekly close is characteristic of a market absorbing supply without establishing directional follow-through. Today's session is tighter still, with a $1,179 span between $76,000 and $77,179, and a close near the upper half of that band.
On the moving averages, the configuration leans cautious. Price at $76,556 is below the MA7 at $76,849 and more meaningfully below the MA30 at $77,697. The 30-day average has acted as a ceiling in recent sessions rather than a floor, and the gap between spot and the MA30 (~1.5%) reflects the fade from the 30-day high of $82,300. That $82,300 print marks the upper boundary of the current 30-day range, while the 30-day low at $64,166 — roughly 16% below current levels — frames the full extent of the recovery that has unfolded over the month.
Momentum is the most notable data point. RSI(14) at 30.4 is at the threshold conventionally associated with oversold conditions. In the context of a market that is still +10.41% over 30 days, this divergence — positive monthly performance alongside depressed short-term momentum — suggests recent sessions have retraced a portion of the prior advance rather than reversed it. The 7-day high at $79,890 is the level that would need to be reclaimed to shift the short-term structure, while the 7-day low at $74,968 marks the downside reference established this week.
Volume reinforces the muted tone. At 0.46x the 7-day average, participation is less than half of the recent norm. Low-volume pullbacks into oversold RSI territory are a recurring feature of consolidation phases, but they also mean the current price levels have not been stress-tested by heavy flow. Taken together, BTC is in a defined range with soft momentum, thin volume, and price below its short- and medium-term averages — a consolidation profile rather than a trending one.
Ethereum Analysis
TradingView Live (4h)
Ethereum's session is modestly stronger than Bitcoin's on a relative basis. ETH trades at $2,458, up 1.65% over 24 hours, with an intraday range of $2,414 to $2,480. The weekly gain stands at +0.82%, and the 30-day gain at +9.12% — both positive, and both achieved with less drawdown than BTC experienced over the same window.
The moving average picture is constructive but not decisive. Price at $2,458 sits just above the MA30 at $2,456 — a marginal hold of the medium-term average — while remaining slightly below the MA7 at $2,473. This is a far tighter relationship between spot and both averages than BTC shows, with the three values clustered within roughly $17 of each other. When price, MA7, and MA30 converge this closely, it typically reflects a market that has found an equilibrium zone; direction is resolved by which side price settles on with volume.
That equilibrium is visible in the range data. The 7-day high and the 30-day high are identical at $2,666, meaning ETH has not exceeded its weekly peak in a month — the recent high-water mark was set within the last seven sessions. The 7-day low at $2,359 and 30-day low at $1,906 bracket a substantial recovery: the 30-day low is approximately 22% below the current price, underscoring how far ETH has traveled over the month despite the recent stall. The immediate downside reference is the $2,359 weekly low, with $2,414 today's session low.
RSI(14) at 45.4 is squarely neutral — neither oversold like BTC's 30.4 nor stretched to the upside. This gives ETH more room in either direction from a momentum standpoint and helps explain why it is holding its averages better than BTC. Volume at 0.40x the 7-day average is the lowest reading in this dataset, thinner even than BTC's. The combination of neutral RSI, price pinned to converging moving averages, and light volume describes a market in balance, waiting for a catalyst rather than expressing one.
Key Technical Levels
| Asset | Support | Resistance | RSI |
|---|---|---|---|
| BTC | $74,968 (7d low) / $76,000 (24h low) | $77,697 (MA30) / $79,890 (7d high) | oversold (30.4) |
| ETH | $2,414 (24h low) / $2,359 (7d low) | $2,473 (MA7) / $2,666 (7d & 30d high) | neutral (45.4) |
BTC vs ETH Dynamic
The two majors are moving in the same direction today — both green on the 24-hour and 30-day windows — but with a clear dispersion in momentum quality. ETH's +1.65% session versus BTC's +0.46% extends a pattern visible across the data: ETH is +9.12% over 30 days against BTC's +10.41%, yet ETH's RSI (45.4) is materially healthier than BTC's (30.4), and ETH is holding its MA30 while BTC is below both averages. Both assets show volume at less than half their 7-day averages (0.46x for BTC, 0.40x for ETH), so the correlation is currently one of shared low participation rather than shared conviction. In practical terms, the pair is coiling together in thin conditions, with ETH showing the steadier technical footing of the two.
Strategy Fit
Today's data describes a low-volatility, range-bound environment: BTC pinned between $74,968 and $79,890 with RSI at 30.4, ETH compressed between $2,359 and $2,666 with RSI at 45.4, and both assets trading on volume below half their recent averages. In conditions like these, range-oriented approaches — such as grid strategies that place layered orders around a defined band — are structurally aligned with the market's behavior, since price is oscillating rather than trending. For participants with a longer horizon, the oversold RSI on BTC and neutral reading on ETH also keep systematic accumulation approaches, like DCA, relevant regardless of short-term direction. Trend-following strategies, by contrast, have less to work with while price remains below key moving averages and volume stays thin. Pionex offers built-in bots — including grid trading and DCA bots — that automate these approaches, letting users set parameters around the support and resistance levels identified above without manual order management. Matching strategy to the prevailing regime, rather than forcing a trend approach into a ranging tape, is the practical takeaway from today's setup.
Risk Disclaimer
This market recap is provided for informational purposes only and does not constitute financial, investment, or trading advice. Cryptocurrency markets are highly volatile and can result in the loss of all invested capital. The technical levels, indicators, and strategy observations discussed above are based on historical data as of 2026-09-17 and carry no predictive guarantee. Past performance is not indicative of future results. Always conduct your own research and consult a qualified financial professional before making any investment decision.
FAQ
What is Bitcoin's price today?
BTC is trading at $76,556, up 0.46% over the past 24 hours, within a daily range of $76,000 to $77,179.
What is Ethereum's price today?
ETH is trading at $2,458, up 1.65% over the past 24 hours, within a daily range of $2,414 to $2,480.
What does BTC's RSI of 30.4 indicate?
An RSI(14) reading of 30.4 places Bitcoin at the threshold of oversold territory, reflecting weak short-term momentum even as BTC remains +10.41% over 30 days.
Why is trading volume so low today?
BTC volume is at 0.46x its 7-day average and ETH at 0.40x, indicating reduced market participation and thin liquidity across both majors.
Which strategy suits the current market?
With both assets range-bound and volume light, grid and DCA approaches — available as built-in bots on Pionex — are structurally aligned with present conditions, while trend strategies have limited traction below key moving averages.


