BTC ETH Daily Recap – July 29, 2026

BTC ETH Daily Recap – July 29, 2026
Today at a Glance
On July 29, 2026, Bitcoin (BTC) and Ethereum (ETH) exhibited divergent short-term momentum, with BTC posting a modest 24-hour gain of +1.06% while ETH slipped 0.77%. BTC traded in a tight range between $63,598 and $64,745, closing near the session high at $64,596, supported by its 7-day moving average ($64,469). The Relative Strength Index (RSI) for BTC sits at 49.2, indicating neutral territory with no clear directional bias. ETH, meanwhile, showed relative weakness, with its 24-hour range of $1,885 to $1,929 failing to reclaim the $1,900 psychological level. ETH’s RSI at 48.8 also signals a neutral stance. Over the past week, both assets have pulled back from recent highs—BTC down 2.30% from its 7-day peak of $66,313, and ETH down 1.39% from $1,981. However, the 30-day picture remains bullish: BTC has gained 10.18% from its monthly low of $57,800, while ETH has surged 21.34% from $1,550. Trading volumes for both assets are notably below their 7-day averages (BTC at 0.6x, ETH at 0.59x), suggesting cautious market participation and potential consolidation ahead.
Bitcoin Analysis
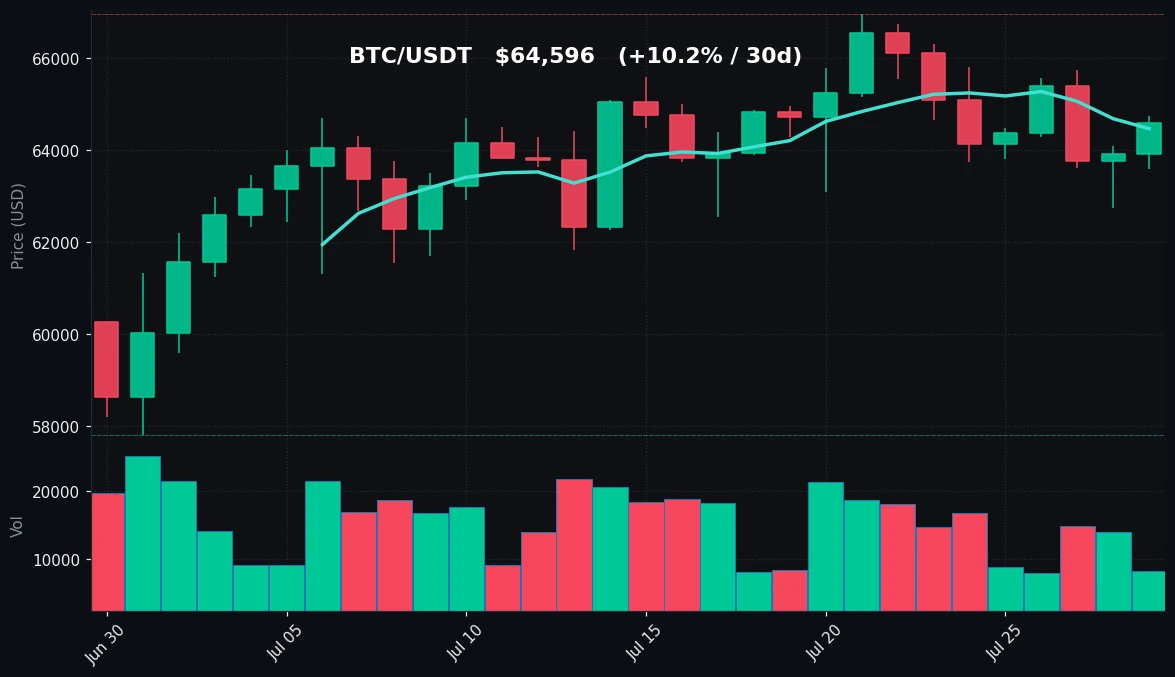
TradingView Live (4h)
Bitcoin’s price action on July 29 was characterized by a gradual recovery from the overnight low of $63,598, with buyers stepping in near the $63,600 support zone. The session high of $64,745 was tested but not breached, leaving BTC trading just below the $64,600 handle. The 7-day moving average (MA7) at $64,469 provided a critical intraday anchor, while the 30-day moving average (MA30) at $63,764 acted as a solid support floor during the week. Over the past 7 days, BTC has retraced 2.30% from its weekly high of $66,313, but the broader 30-day trend remains positive, with a 10.18% gain from the monthly low of $57,800.
From a technical perspective, BTC is hovering in a zone of indecision. The RSI(14) at 49.2 sits exactly at the midpoint of the neutral range (30-70), indicating that neither bulls nor bears have seized control. The volume reading of 0.6x the 7-day average highlights a lack of conviction—traders are not aggressively accumulating or distributing at current levels. The $64,745 resistance (today’s high) aligns closely with the $64,800 level that acted as support earlier in the month, making it a key barrier. On the downside, immediate support lies at $63,598 (today’s low) and the MA30 at $63,764. A break below $63,500 could open the door to the $62,742 weekly low, while a move above $64,800 would challenge the $66,313 weekly resistance. The neutral RSI and below-average volume suggest a period of consolidation, with BTC likely to remain range-bound between $63,500 and $64,800 until a volume catalyst emerges.
Ethereum Analysis
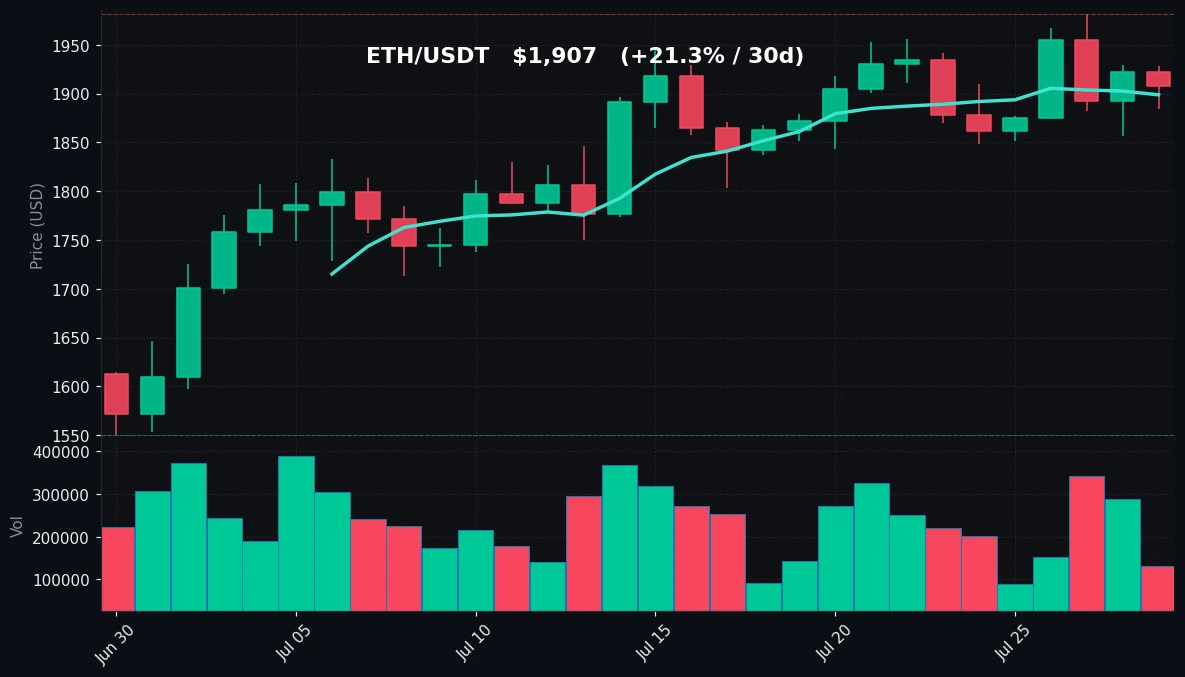
TradingView Live (4h)
Ethereum’s performance on July 29 was softer than Bitcoin’s, reflecting a 0.77% decline from the previous day. ETH traded in a $44 range, with the low at $1,885 and the high at $1,929, failing to sustain a rally above the $1,900 psychological level. The 7-day moving average at $1,899 provided a brief support during the session, but the price closed just above it at $1,907. The 30-day moving average at $1,825 remains a key structural support, having held firm during the 7-day pullback from the weekly high of $1,981. Over the past month, ETH has outperformed BTC with a 21.34% gain from its 30-day low of $1,550, but the recent 1.39% weekly decline suggests profit-taking and consolidation.
The RSI(14) for ETH stands at 48.8, similarly neutral to BTC’s reading, indicating no overbought or oversold conditions. The volume at 0.59x the 7-day average is even lower than BTC’s, reflecting diminished trading interest. This lack of volume makes it difficult for ETH to break out of its current range. The $1,929 resistance (today’s high) is the immediate upside barrier, followed by the $1,981 weekly high. On the downside, $1,885 (today’s low) and $1,848 (weekly low) are critical supports. The MA30 at $1,825 provides a strong safety net. Given the neutral RSI and low volume, ETH is likely to continue consolidating between $1,885 and $1,929, with a potential test of the $1,848 support if selling pressure increases. The divergence from BTC’s slight gain today highlights that ETH is currently the weaker of the two assets in the short term.
Key Technical Levels
| Asset | Support | Resistance | RSI |
|---|---|---|---|
| BTC | $63,598 / $62,742 | $64,745 / $66,313 | 49.2 (neutral) |
| ETH | $1,885 / $1,848 | $1,929 / $1,981 | 48.8 (neutral) |
BTC vs ETH Dynamic
The correlation between Bitcoin and Ethereum remains high, but today’s action shows a slight decoupling in short-term momentum. BTC’s 1.06% gain contrasted with ETH’s 0.77% decline, a divergence that is unusual given their typical strong positive correlation. Over the past week, both assets have trended lower in tandem, but BTC’s ability to hold above its MA7 while ETH struggles to reclaim $1,900 suggests that Bitcoin is currently acting as a relative safe haven within the crypto market. The 30-day performance gap—BTC up 10.18% versus ETH up 21.34%—indicates that ETH had a stronger rally from its monthly low, making it more susceptible to profit-taking. The neutral RSI readings for both assets confirm that the market is in a wait-and-see mode, with no clear directional catalyst. Traders should watch for a breakout in either asset to confirm the next trend.
Strategy Fit
Given the current market conditions—low volume, neutral RSI, and tight trading ranges—a grid trading strategy is best suited for both BTC and ETH. The lack of directional momentum and the presence of well-defined support and resistance levels make grid bots ideal for capturing profits from small price oscillations. For example, a grid bot set between $63,500 and $64,800 for BTC, or between $1,885 and $1,929 for ETH, can generate consistent returns as prices bounce within these ranges. The below-average volume also favors a DCA (Dollar-Cost Averaging) approach for longer-term positions, as the neutral RSI suggests that accumulation at current levels may be favorable without chasing a breakout. Trend-following strategies are not recommended in this environment due to the absence of a clear trend. Pionex’s built-in grid trading bots and DCA bots are well-suited to these conditions, allowing users to automate trades and manage risk efficiently. For risk-averse traders, a neutral stance with a focus on range-bound trading is the most prudent approach.
Risk Disclaimer
This market recap is for informational and educational purposes only and does not constitute financial advice, investment recommendations, or trading signals. Cryptocurrency markets are highly volatile and carry significant risk of loss. Past performance is not indicative of future results. Always conduct your own research and consult with a qualified financial advisor before making any investment decisions. The author and Pionex are not responsible for any trading losses incurred based on the information provided herein.
FAQ
Q1: Why did Bitcoin rise while Ethereum fell today?
Bitcoin’s slight gain (+1.06%) likely reflects short-term buying interest near support, while Ethereum’s decline (-0.77%) may be due to profit-taking after its stronger 30-day rally (+21.34% vs BTC’s +10.18%). Low trading volumes also contributed to the divergence.
Q2: What do the neutral RSI readings (49.2 for BTC, 48.8 for ETH) mean?
An RSI between 30 and 70 is considered neutral. Current readings indicate that neither asset is overbought nor oversold, suggesting that the market is balanced with no clear directional bias. This typically leads to consolidation.
Q3: Are the current low trading volumes a concern?
Below-average volumes (0.6x and 0.59x of the 7-day average) indicate reduced market participation. This can lead to false breakouts or increased volatility, but it also supports range-bound trading strategies like grid bots.
Q4: What are the key levels to watch for a breakout?
For BTC, a breakout above $64,745 could target $66,313, while a break below $63,598 may lead to $62,742. For ETH, a move above $1,929 targets $1,981, and a break below $1,885 could test $1,848.
Q5: Which trading strategy is best for this market environment?
Grid trading is ideal for the current range-bound, low-volume conditions. DCA is also suitable for long-term accumulation. Trend-following strategies should be avoided until a clear breakout occurs.


