BTC ETH Daily Recap — 2026-09-24

BTC ETH Daily Recap — 2026-09-24
Today at a Glance
Bitcoin is trading at $84,192, down 0.24% over the past 24 hours after printing a session range between $82,875 and $84,622. The modest daily pullback does little to dent a strong week: BTC is up 10.17% over seven days and 6.54% over 30 days, holding well above both its 7-day moving average ($83,533) and 30-day moving average ($79,416). RSI(14) sits at 70.5, placing momentum right at the overbought threshold, while volume has cooled to 0.57x the 7-day average.
Ethereum is at $2,668, down 0.61% on the day within a $2,600–$2,704 range. ETH has gained 9.03% over seven days and 6.44% over 30 days, with RSI(14) at 64.8 — firm but below overbought. Volume is notably light at 0.4x the 7-day average, and price is trading marginally below its 7-day MA of $2,682 while remaining comfortably above its 30-day MA of $2,518.
Bitcoin Analysis
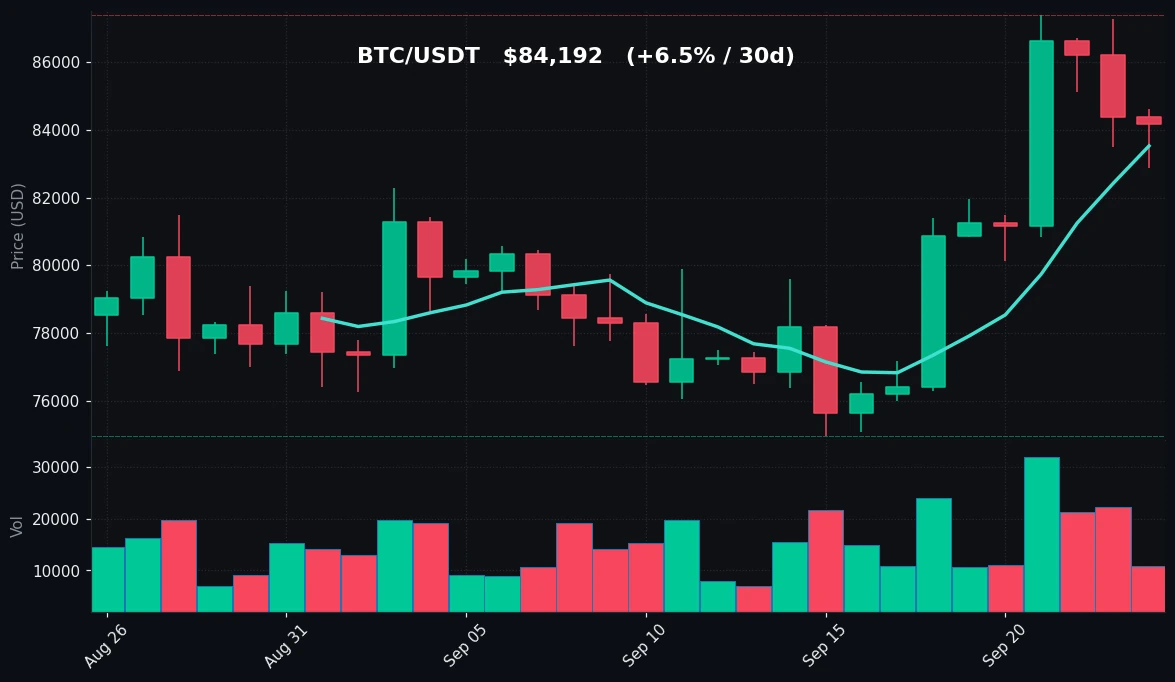
TradingView Live (4h)
Bitcoin's daily structure remains constructive despite today's slight negative close. The asset is consolidating near the upper end of its recent range, having established a 7-day high of $87,396 and a 7-day low of $76,296 — a roughly 14.5% swing that underscores how volatile the past week has been. The 30-day range is similarly wide, with a low of $74,968 and a high matching the 7-day peak at $87,396. This tells us the current price zone around $84,000 is part of a broader recovery leg rather than a fresh breakout into new territory.
On the moving averages, the picture is clearly bullish in trend terms. Price at $84,192 sits above the MA7 of $83,533, which in turn sits well above the MA30 of $79,416. The stacking of the short-term average above the longer-term average, with price above both, is a textbook bullish alignment. The gap between MA7 and MA30 — roughly $4,100, or about 5.2% — indicates that the recent upward impulse has been sharp enough to pull short-term averages meaningfully above the monthly baseline. That kind of separation can persist in strong trends, but it also means price has less "slack" before testing its nearest dynamic support.
Momentum is the key nuance today. RSI(14) at 70.5 is marginally in overbought territory. In sustained uptrends, RSI can hold above 70 for extended periods, so this reading alone is not a reversal signal — it is a state description. What matters more is the combination: overbought RSI alongside volume at just 0.57x the 7-day average. The rally into the $87,396 high was not accompanied by expanding participation on this particular day, which suggests the move is being driven by thinner flow rather than broad aggressive accumulation.
Key levels to monitor are straightforward. On the downside, the MA7 at $83,533 is the first dynamic support, followed by the psychological $82,875 area (today's low) and then the $79,416 MA30 as the structural floor for the current trend. On the upside, $84,622 (today's high) is the immediate cap, with the $87,396 weekly and monthly high standing as the major resistance ceiling. A daily close above $87,396 would confirm range expansion; a close below the MA30 would weaken the bullish alignment. For now, BTC is best described as trending higher but pausing, with momentum stretched and volume light.
Ethereum Analysis
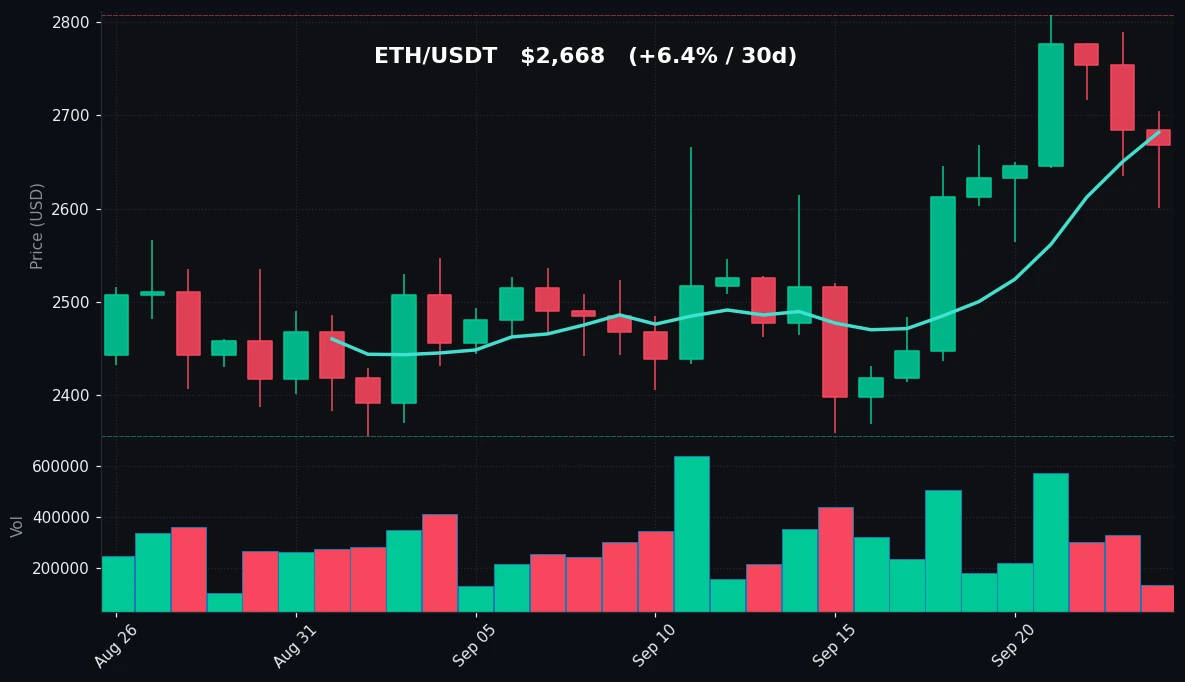
TradingView Live (4h)
Ethereum's structure mirrors Bitcoin's but with slightly softer momentum characteristics. At $2,668, ETH is trading just below its MA7 of $2,682 — a marginal but notable difference from BTC, which remains above its short-term average. The MA30 at $2,518 is far below current price, leaving ETH about 6% above its monthly baseline. The moving averages remain in bullish order (price above MA30, MA7 above MA30), but the fact that price has slipped under the MA7 suggests the immediate upward momentum has stalled more visibly than in BTC.
The weekly range for ETH spans from $2,437 to $2,807, a swing of roughly 15.2%. The 30-day low of $2,356 and 30-day high of $2,807 frame the broader picture: ETH has recovered strongly from its monthly lows but is currently about 5% below the peak of that range. Today's session traded between $2,600 and $2,704, a narrower band than BTC's, and closed near the lower-middle of it.
RSI(14) at 64.8 is the most informative reading here. Unlike BTC's 70.5, ETH's momentum gauge has not reached overbought. This means ETH has room to run before hitting the same stretched condition BTC already occupies — but it also means ETH is not showing the same relative strength. When the larger-cap asset (BTC) carries a higher RSI than the smaller-cap asset (ETH) during a shared uptrend, it typically signals that capital is favoring the more established, liquid name. That is a defensive posture within the risk curve.
Volume is the standout data point: 0.4x the 7-day average is very light. For an asset that has moved 9% in a week, such thin participation implies the move is not being broadly validated by trading activity. Low-volume advances can continue, but they are more vulnerable to sharp retracements when a seller appears. The immediate support zone is $2,600 (today's low), with the MA7 at $2,682 now acting as nearby resistance rather than support. Below that, the MA30 at $2,518 is the trend-defining level. Resistance sits at $2,704 (today's high) and then $2,807, the weekly and monthly ceiling. ETH is consolidating within an uptrend, but its momentum and volume profile are softer than BTC's.
Key Technical Levels
| Asset | Support | Resistance | RSI |
|---|---|---|---|
| BTC | $83,533 (MA7) / $82,875 (24h low) / $79,416 (MA30) | $84,622 (24h high) / $87,396 (7d & 30d high) | 70.5 — overbought |
| ETH | $2,600 (24h low) / $2,518 (MA30) | $2,682 (MA7) / $2,704 (24h high) / $2,807 (7d & 30d high) | 64.8 — neutral-to-firm |
BTC vs ETH Dynamic
BTC and ETH are moving in the same direction but not with the same intensity. Both are up strongly over 7 days (BTC +10.17%, ETH +9.03%) and over 30 days (BTC +6.54%, ETH +6.44%), and both pulled back modestly today (BTC -0.24%, ETH -0.61%). The correlation in direction is high, which is typical for the pair during broad market moves. However, the divergence shows up in the details: BTC holds above its MA7 while ETH sits below it; BTC's RSI is at 70.5 versus ETH's 64.8; and ETH's volume ratio (0.4x) is even lighter than BTC's (0.57x). This suggests that within the current leg, BTC is the relative-strength leader and ETH is the higher-beta follower that has not yet confirmed equivalent momentum. Traders watching rotation would note that ETH's underperformance on RSI and its position below the MA7 are the tell — if the pair continues higher, ETH may play catch-up; if the pair corrects, ETH's thinner volume could amplify downside.
Strategy Fit
Today's conditions — elevated RSI on BTC, sub-MA7 price on ETH, and notably light volume on both — describe a market that is trending but pausing, with momentum stretched and participation thin. This is a mixed environment for strategy selection. Trend-following approaches remain structurally supported by the bullish moving-average alignment on both assets, but entering trend positions at overbought RSI with weak volume carries timing risk. Mean-reversion or grid strategies, which profit from range-bound oscillation, may fit the current consolidation phase better, particularly for ETH, which is pinned between $2,600 support and $2,682–$2,704 resistance. For BTC, the wider $82,875–$87,396 band offers a broader grid envelope, though the overbought RSI argues for tighter position sizing. Dollar-cost averaging remains a neutral-fit approach for participants who want exposure without timing the stretched momentum. Pionex offers built-in bots designed for exactly these conditions — grid trading bots for range-bound markets and DCA bots for gradual accumulation — allowing users to automate execution according to their own risk parameters rather than reacting to single-day prints. Strategy choice should always match the individual's risk tolerance and time horizon, not just the day's data.
Risk Disclaimer
This article is for informational purposes only and does not constitute financial, investment, or trading advice. Cryptocurrency markets are highly volatile and can result in the loss of all invested capital. The data and levels discussed reflect a single point in time (2026-09-24) and may change rapidly. Always conduct your own research and consult a qualified professional before making any investment decision.
FAQ
What was Bitcoin's price on 2026-09-24?
BTC/USDT traded at $84,192, down 0.24% over 24 hours, with a session high of $84,622 and low of $82,875.
Is Bitcoin overbought right now?
BTC's RSI(14) is 70.5, which places it marginally in overbought territory. This reflects stretched momentum but is not by itself a reversal signal in a sustained uptrend.
How did Ethereum perform compared to Bitcoin?
ETH was at $2,668, down 0.61% on the day, with a 7-day gain of 9.03% versus BTC's 10.17%. ETH also has a lower RSI (64.8) and lighter relative volume (0.4x vs 0.57x).
What are the key support and resistance levels?
For BTC, support sits at $83,533 (MA7) and $79,416 (MA30), with resistance at $84,622 and $87,396. For ETH, support is at $2,600 and $2,518 (MA30), with resistance at $2,682 (MA7), $2,704, and $2,807.
What trading strategy suits today's market conditions?
With stretched RSI and light volume during a pause within an uptrend, grid and DCA approaches may fit better than aggressive trend entry. Pionex provides built-in grid and DCA bots for automating these strategies, but all choices should align with personal risk tolerance.


