BTC ETH Daily Recap — 2026-09-25

BTC ETH Daily Recap — 2026-09-25
Today at a Glance
Bitcoin is trading at $83,466, down 1.12% over the past 24 hours after printing a session high of $85,255 and drifting to its low at the current price. Despite the soft daily candle, the broader trend remains constructive: BTC is up 3.19% on the week and 4.01% on the month, holding comfortably above both its 7-day moving average of $83,933 and its 30-day moving average of $79,571. RSI(14) sits at 66.7, close to but not inside overbought territory, while volume is running at just 0.58x the 7-day average — a quiet pullback rather than a distribution event.
Ethereum is at $2,678, down a milder 0.39% on the day, with a 24-hour range of $2,743 to $2,667. ETH is +2.50% on the week and +6.64% on the month, trading near its 7-day MA of $2,694 and well above its 30-day MA of $2,524. RSI(14) is 61.5, and volume is even lighter at 0.45x the 7-day average. Both majors are consolidating recent gains on thinning participation.
Bitcoin Analysis
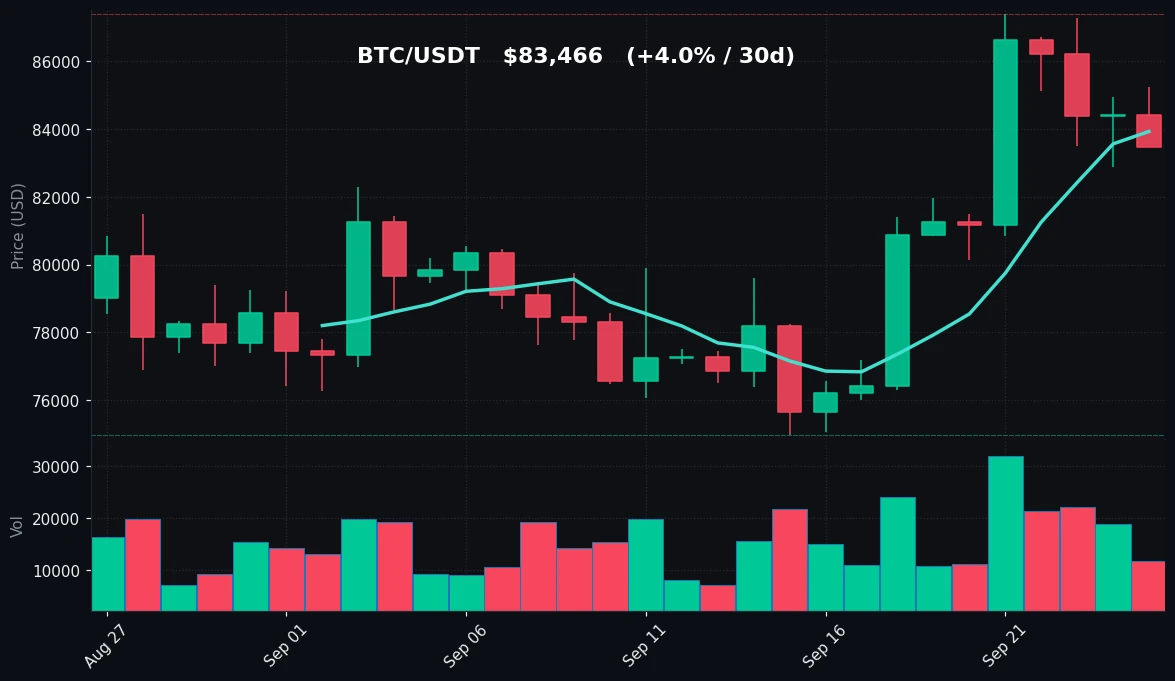
TradingView Live (4h)
Bitcoin enters the September 25 session in a consolidation phase near the upper end of its monthly range. The 30-day high of $87,396, set earlier in the period, remains the key structural ceiling, while the 30-day low of $74,968 marks the base of the advance that has carried price roughly 11% higher from that floor. On the 7-day horizon, the range is tighter: a high of $87,396 against a low of $80,126, with the current price of $83,466 sitting in the lower-middle portion of that band.
The moving average structure is unambiguously bullish in its alignment. The MA7 at $83,933 and MA30 at $79,571 are both below the last traded price, and the MA7 sits above the MA30 by roughly $4,360 — a positive spread that reflects the upward slope of the short-term trend. The fact that BTC is trading marginally below the MA7 ($83,933) rather than far beneath it suggests this is a routine mean-reversion dip within an intact uptrend, not a trend break. A sustained close below the MA7 would put the MA30 at $79,571 in focus as the next structural reference; the 7-day low at $80,126 sits just above that level, reinforcing the $79,500–$80,100 zone as a meaningful support cluster.
Momentum is firm but not stretched. RSI(14) at 66.7 is in the upper half of the neutral band and below the traditional 70 overbought threshold. That reading is consistent with a market that has absorbed recent gains without exhausting buying capacity. Notably, the daily decline of 1.12% has not produced a sharp RSI rollover, which argues for a controlled pullback rather than a momentum failure.
Volume is the day's most notable signal — or lack thereof. At 0.58x the 7-day average, participation is roughly 42% below normal. Low-volume pullbacks carry less informational weight than high-volume declines: they often reflect profit-taking and a pause in new positioning rather than aggressive selling. The session low of $83,466 is the current price, meaning BTC closed the 24-hour window at its weakest level, so short-term follow-through risk into the $83,000 handle remains a watch item. Above, the $85,255 session high is the first intraday resistance, with the $87,396 monthly high as the broader ceiling. Net: trend intact, momentum neutral-to-firm, volume light, structure defined by $79,571–$80,126 support and $85,255–$87,396 resistance.
Ethereum Analysis
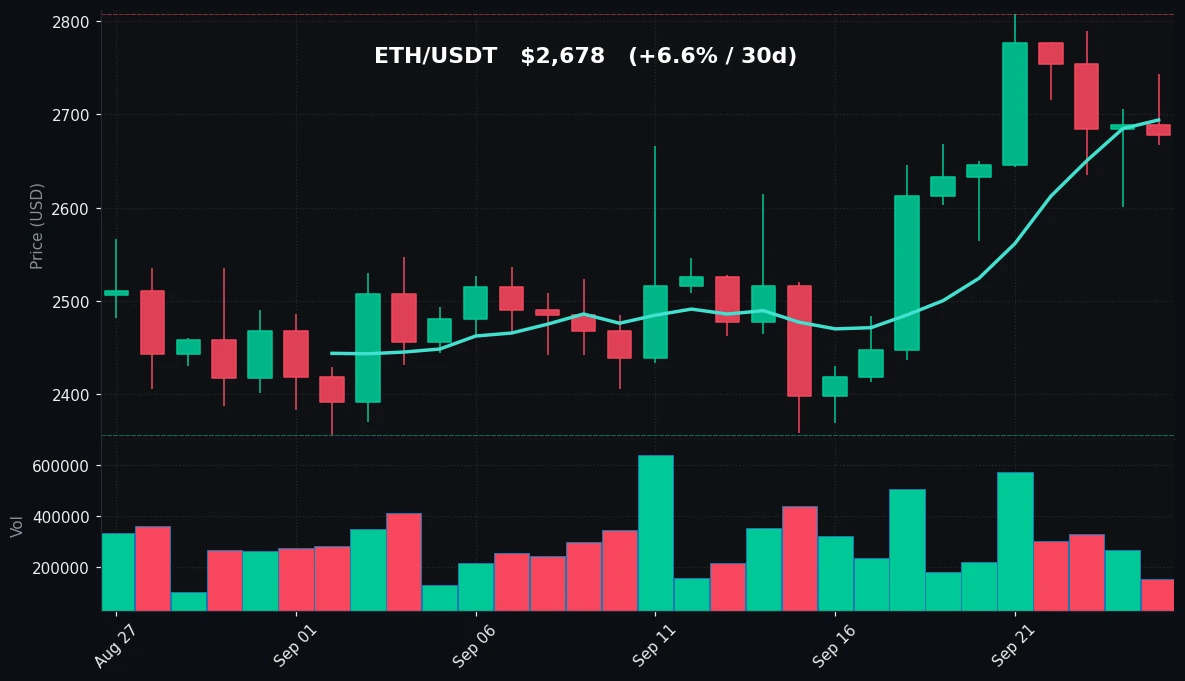
TradingView Live (4h)
Ethereum is trading at $2,678, holding a similarly constructive but slightly softer posture than Bitcoin on the day. The 24-hour range of $2,743 to $2,667 is narrow in percentage terms, and the 0.39% decline is modest relative to BTC's 1.12% drop — ETH has shown relative resilience in this session. On the week, ETH is +2.50%, and on the month it is +6.64%, outpacing BTC's 4.01% 30-day gain and reinforcing the idea that ETH has been the stronger of the two majors over the trailing month.
The moving average picture mirrors Bitcoin's bullish alignment. The MA7 at $2,694 is above the MA30 at $2,524, and the current price of $2,678 sits just below the MA7 while remaining roughly $154 above the MA30. That configuration — price above the longer-term average, hovering near the shorter-term average — is typical of a healthy uptrend digesting recent gains. The 30-day low at $2,356 and the 30-day high at $2,807 frame the broader range; the 7-day low at $2,564 is the nearer structural floor.
Key levels for ETH are well defined by recent price action. On the downside, $2,667 (the session low) and $2,564 (the 7-day low) form the first two support tiers, with the MA30 at $2,524 just beneath as a deeper trend reference. On the upside, $2,743 (session high) is the immediate hurdle, followed by the 7-day and 30-day high at $2,807 — a level that has capped price on both timeframes and therefore carries outsized significance as a breakout trigger.
RSI(14) at 61.5 is solidly neutral, cooler than BTC's 66.7 and with more headroom before approaching overbought conditions. As with BTC, the momentum gauge has not deteriorated despite the modest daily decline, supporting a consolidation interpretation.
The most striking data point is volume: 0.45x the 7-day average, meaning activity is running at less than half its recent norm. This is notably thinner than BTC's already-light 0.58x, and it suggests ETH's current price discovery is occurring on limited participation. Thin tape cuts both ways — moves can extend further on small flows, but the lack of conviction behind the pullback means it should be weighted cautiously as a directional signal. Net: uptrend intact, RSI neutral, volume very light, with $2,564–$2,524 as the support shelf and $2,743–$2,807 as the resistance band to watch.
Key Technical Levels
| Asset | Support | Resistance | RSI |
|---|---|---|---|
| BTC | $79,571–$80,126 | $85,255–$87,396 | Neutral (66.7) |
| ETH | $2,524–$2,564 | $2,743–$2,807 | Neutral (61.5) |
For BTC, the support band combines the MA30 at $79,571 with the 7-day low at $80,126; resistance stacks the 24-hour high at $85,255 against the 7-day and 30-day high at $87,396. For ETH, support pairs the MA30 at $2,524 with the 7-day low at $2,564, while resistance spans the session high at $2,743 and the 7-day/30-day high at $2,807. Both RSI readings fall in the neutral zone, below the 70 overbought line.
BTC vs ETH Dynamic
Bitcoin and Ethereum are moving in close lockstep today, both posting modest daily declines on well-below-average volume while preserving positive weekly and monthly returns. The correlation is evident in the shared pattern: each is trading just under its respective MA7, comfortably above its MA30, with RSI in the low-to-mid 60s and volume at roughly half of normal. ETH is showing a slight relative edge — a smaller daily drawdown (-0.39% vs -1.12%) and a larger 30-day gain (+6.64% vs +4.01%) — but the divergence is modest and consistent with normal rotation within a correlated major-cap complex. When both assets pull back on sub-0.6x volume simultaneously, it typically signals a market-wide pause in participation rather than asset-specific weakness. Traders watching the pair will likely focus on whether BTC can reclaim its MA7 at $83,933 and ETH its MA7 at $2,694, since a joint recovery of those short-term averages would reaffirm the shared uptrend.
Strategy Fit
Today's conditions — neutral RSI, intact uptrends, and volume at 0.45x–0.58x of the 7-day average — describe a consolidating market rather than a trending or capitulating one. In this kind of low-volatility, range-bound environment, grid strategies are often a natural fit: they seek to harvest repeated oscillations between defined support and resistance rather than requiring a directional breakout. For BTC, that range is roughly $79,571–$87,396; for ETH, approximately $2,524–$2,807. A grid bot can place layered buy and sell orders within such bands to capture mean-reversion moves.
For participants with a longer horizon, DCA remains a straightforward approach to accumulating through consolidation without timing entries, while trend-following strategies are better suited to environments where price is expanding decisively beyond range boundaries — currently not the case on either chart.
Pionex offers built-in bots that map directly onto these conditions, including grid trading bots, DCA bots, and trend-oriented strategies, all accessible without leaving the exchange. Matching the tool to the regime — grid for range, DCA for accumulation, trend for breakout — is the practical takeaway from today's data. Position sizing and range selection should always reflect the possibility that a low-volume range eventually resolves into a directional move.
Risk Disclaimer
This material is provided for informational purposes only and does not constitute financial, investment, or trading advice. Cryptocurrency markets are highly volatile and can result in the loss of all invested capital. Technical indicators, moving averages, RSI readings, and volume data describe past and current market conditions only; they do not predict future price movements. Nothing in this recap should be interpreted as a recommendation to buy, sell, or hold any asset. Readers should conduct their own research, consider their personal financial situation and risk tolerance, and consult a licensed financial professional where appropriate. Past performance is not indicative of future results.
FAQ
What price is Bitcoin trading at on 2026-09-25?
BTC/USDT is at $83,466, down 1.12% over 24 hours, with a session range of $85,255 (high) to $83,466 (low). It is +3.19% on the week and +4.01% on the month.
What are the key support and resistance levels for Bitcoin?
Support clusters at $79,571–$80,126 (MA30 and 7-day low), while resistance sits at $85,255 (24-hour high) and $87,396 (7-day and 30-day high).
Is Ethereum overbought or oversold?
Neither. ETH's RSI(14) is 61.5, which is in the neutral band and below the 70 overbought threshold. BTC's RSI(14) at 66.7 is also neutral.
Why is trading volume so low today?
BTC volume is 0.58x its 7-day average and ETH is 0.45x, indicating participation is running well below normal. Light volume during a modest pullback typically reflects a pause in positioning rather than aggressive selling.
Which strategy suits the current market conditions?
With both majors consolidating in defined ranges on neutral RSI and light volume, grid strategies are often a natural fit, while DCA suits longer-horizon accumulation. Pionex provides built-in grid, DCA, and trend bots that correspond to these approaches. This is not financial advice.


