BTC ETH Daily Recap — 2026-09-26

BTC ETH Daily Recap — 2026-09-26
Today at a Glance
Bitcoin enters the final stretch of September trading at $83,931, essentially flat over the past 24 hours at -0.20%, with an intraday range of just $83,798–$84,337. The muted session follows a constructive week: BTC is +3.30% over 7 days and +7.82% over 30 days, having recovered from a 30-day low of $74,968 to within roughly 4% of the 30-day and 7-day high at $87,396.
Ethereum trades at $2,686, also little changed on the day at -0.19%, with a tight $2,679–$2,698 range. ETH shows stronger monthly momentum than BTC at +9.97% over 30 days versus +2.04% over 7 days, and sits about 4.3% below its 30-day high of $2,807.
The standout feature of today's tape is volume: BTC is trading at just 0.22x its 7-day average and ETH at 0.17x, a pronounced lull. Both assets hold above their 7-day and 30-day moving averages, while RSI readings of 68.3 (BTC) and 61.7 (ETH) sit in neutral-to-elevated territory without reaching classic overbought extremes.
Bitcoin Analysis
TradingView Live (4h)
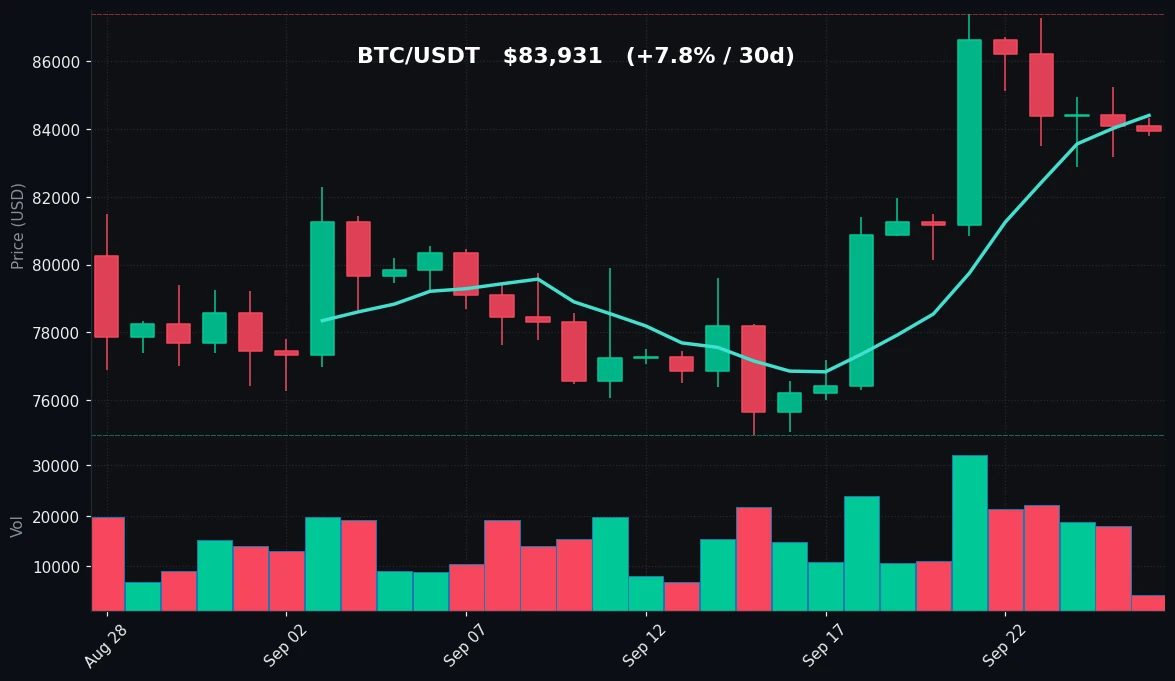
Bitcoin's daily structure remains constructive despite today's flat close. Price at $83,931 sits above both the MA7 at $84,407 — marginally, having dipped just below it intraday — and comfortably above the MA30 at $79,715. The relationship between the two averages is the key structural signal: the 7-day average holding roughly $4,700 above the 30-day average reflects the upward re-pricing that occurred over the past month, when BTC climbed from the $74,968 low to the $87,396 high.
That said, the immediate trend has cooled. BTC has spent the last several sessions consolidating below the $87,396 double-top reference (it is both the 7-day and 30-day high), and today's range of $83,798–$84,337 — barely $539 wide — is one of the tightest of the recent stretch. The $84,337 intraday high failed to reclaim the MA7, leaving a minor overhead band between roughly $84,300 and $84,500 where the 7-day average and recent intraday highs converge.
On the downside, the first reference zone is the $83,798 session low, followed by the broader consolidation floor around the $80,126 7-day low. Below that, the MA30 at $79,715 marks the line that has defined the monthly uptrend; the 30-day low at $74,968 is the deeper structural support.
Momentum is warm but not stretched. RSI(14) at 68.3 is below the 70 threshold, consistent with a market that has rallied without becoming technically overbought — a profile that often accompanies digestion phases rather than exhaustion. The caveat is participation: volume at 0.22x the 7-day average is very light, meaning today's price action carries limited informational weight. Low-volume consolidation near highs can resolve in either direction, and without a volume expansion, the $84,300–$87,396 range remains the operative framework.
Ethereum Analysis
TradingView Live (4h)
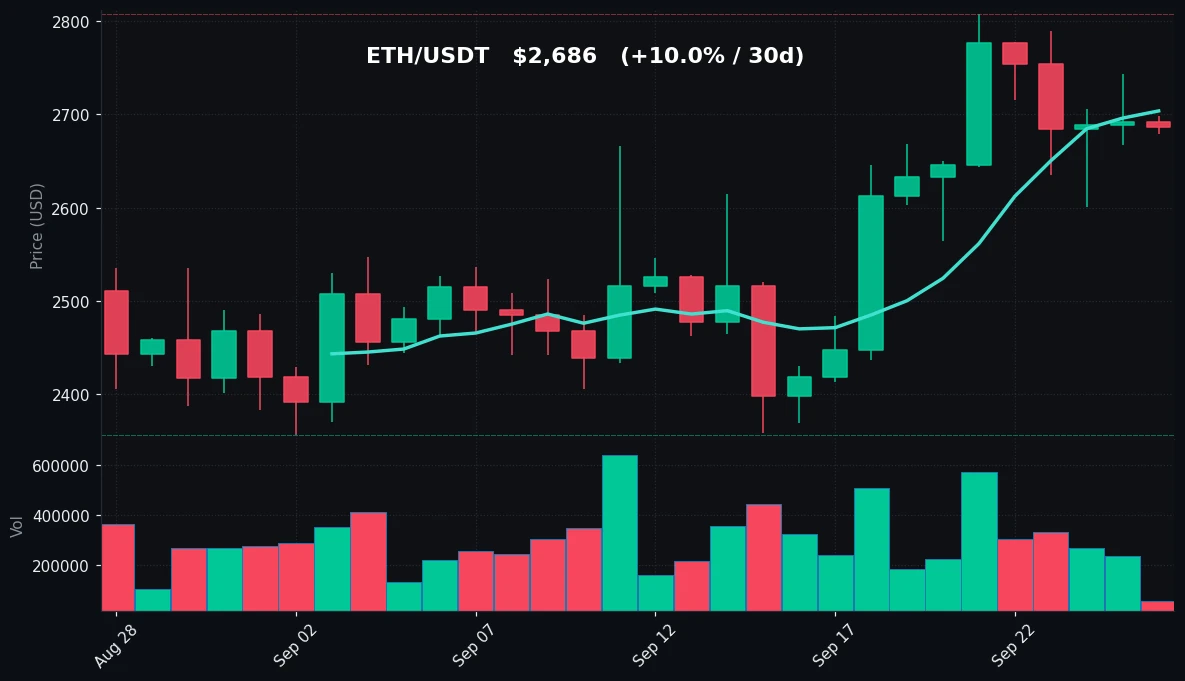
Ethereum mirrors Bitcoin's consolidation but with a slightly different momentum profile. At $2,686, ETH is trading just below its MA7 of $2,704 and well above its MA30 of $2,530, preserving the same bullish moving-average stack seen in BTC — the 7-day average sits roughly $174 above the 30-day, a wider percentage gap than Bitcoin's, reflecting ETH's stronger 30-day performance of +9.97%.
The month's range tells the story: ETH bottomed at $2,356 over the 30-day window and rallied to a high of $2,807, a move of roughly 19% peak-to-trough. Since tagging that high, price has retraced to the mid-$2,600s, which represents a giveback of approximately 4.3% from the peak — a shallow pullback relative to the advance, and one that has so far held above the rising 30-day average.
Today's session was notably compressed: a range of just $2,679–$2,698, or about $19. The immediate resistance band sits at $2,700–$2,704, where the session high and the MA7 converge. A sustained hold above that zone would put the $2,807 monthly high back in view as the next structural reference. Support is defined first by today's low near $2,679, then by the $2,564 7-day low, with the MA30 at $2,530 and the $2,356 30-day low forming deeper layers.
RSI(14) at 61.7 is cooler than Bitcoin's 68.3, suggesting ETH has more technical headroom before momentum readings become elevated. However, the volume picture is even thinner than BTC's: 0.17x the 7-day average. That combination — moderate RSI, price above key averages, and anemic volume — describes a market in wait-and-see mode rather than one in active distribution or accumulation.
Key Technical Levels
| Asset | Support | Resistance | RSI |
|---|---|---|---|
| BTC | $83,798 / $80,126 / $79,715 | $84,337 / $84,407 / $87,396 | 68.3 — neutral, approaching overbought |
| ETH | $2,679 / $2,564 / $2,530 | $2,698 / $2,704 / $2,807 | 61.7 — neutral |
BTC vs ETH Dynamic
BTC and ETH are moving in near-lockstep on the day, with 24-hour changes of -0.20% and -0.19% respectively — a spread of just one basis point, indicating tightly correlated, low-conviction trading. The divergence appears on longer horizons: ETH's +9.97% 30-day gain outpaces BTC's +7.82%, continuing the pattern of ETH beta outperforming during recovery phases. Both assets share the same microstructure signature today — price above the 30-day average, marginally below the 7-day average, RSI in the 60s, and volume at a fraction of recent norms — which suggests the same macro driver (or lack thereof) is governing both books. In this regime, ETH typically amplifies BTC's directional moves, so the correlation is likely to persist until either asset breaks its current range on meaningful volume.
Strategy Fit
Today's conditions — compressed intraday ranges ($539 for BTC, $19 for ETH), price oscillating around the 7-day average, RSI in neutral territory, and volume at just 0.17x–0.22x of the 7-day average — describe a range-bound, low-volatility regime rather than a trending one. In such environments, mean-reversion approaches historically see more favorable conditions than momentum-chasing: grid strategies, which place layered buy and sell orders around a defined range, are structurally suited to assets oscillating between established support and resistance. Dollar-cost averaging (DCA) also fits the profile for longer-horizon participants, since accumulation during quiet consolidation avoids chasing extended candles. Trend-following strategies, by contrast, typically need volume expansion and a clean break of the $87,396 (BTC) or $2,807 (ETH) references to confirm direction. Pionex offers built-in bots — including grid trading and DCA bots — that automate these approaches with parameters users define; the choice of strategy should reflect each trader's own risk tolerance and market view.
Risk Disclaimer
This article is for informational purposes only and does not constitute financial, investment, or trading advice. Cryptocurrency markets are highly volatile and can result in the loss of all invested capital. Technical levels, RSI readings, and volume data described above are historical observations, not predictions. Always conduct your own research and consult a qualified professional before making any investment decision.
FAQ
What was Bitcoin's price on 2026-09-26?
BTC/USDT traded at $83,931, down 0.20% over 24 hours, with a session range of $83,798–$84,337.
How did Ethereum perform on the same day?
ETH/USDT closed at $2,686, down 0.19% on the day, within a narrow $2,679–$2,698 range.
Are BTC and ETH overbought right now?
No. BTC's RSI(14) is 68.3 and ETH's is 61.7 — both below the traditional 70 overbought threshold, though BTC is closer to it.
What are the key levels to watch?
For BTC: support at $83,798 and $80,126, resistance at $84,337 and $87,396. For ETH: support at $2,679 and $2,564, resistance at $2,698 and $2,807.
Why is trading volume so low?
BTC volume is at 0.22x and ETH at 0.17x their respective 7-day averages, indicating a quiet consolidation session with limited participation rather than a directional move.


